Mapp Intelligence: World Map and Word Cloud Enhancements
We've made some helpful updates to our visualizations!
Our world map is now more interactive, allowing you to quickly add specific countries as filters to get more detailed regional information. We've also improved our Word Cloud visualization, making it easy to pick out the phrases important to your users
Key Benefits
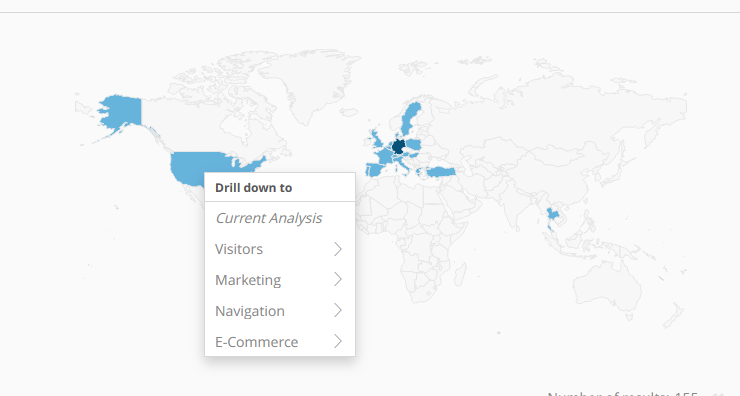
Global view: The globe graphic has been improved. You can add a country as a filter to your analysis with a simple right-click. This is great if you want to create regionally specific-reports for different countries. If you left-click on the map, you can see the region view for that country. Please note that the left-click region view will not be added as a filter to your analysis; if you refresh the page, it will disappear.
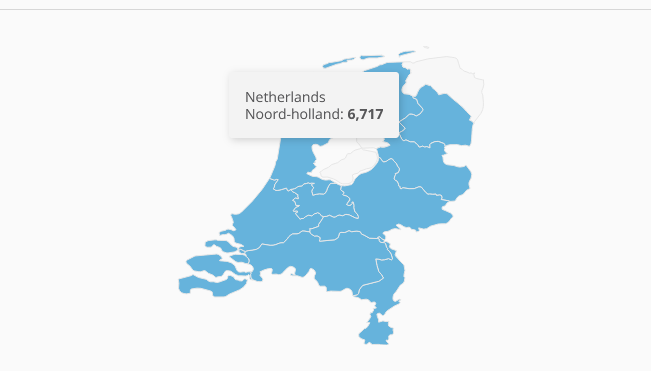
Regional view: for any single country, you can now see the data specified by region.
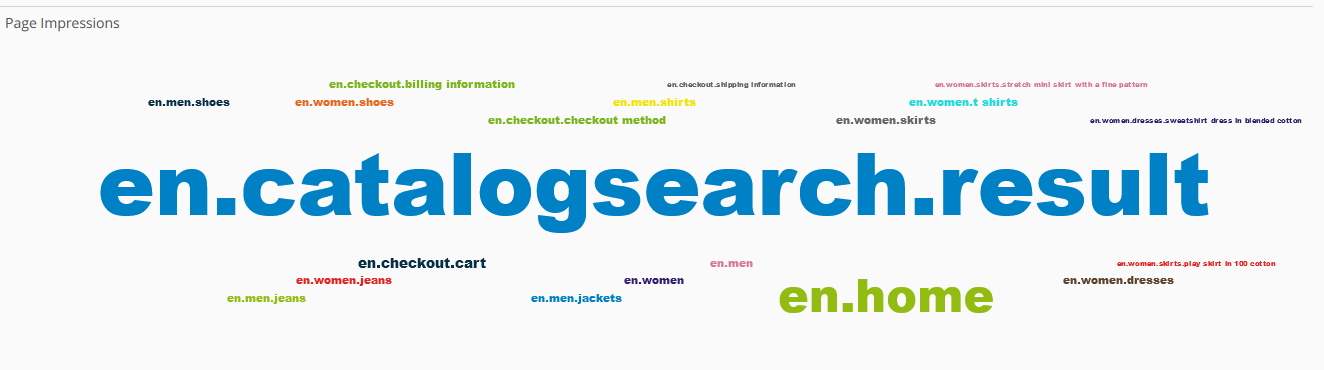
Word Cloud: our cloud visualization is more colorful and spaced out to provide improved readability.
How does it work?
To see the new Regions analysis in Mapp Intelligence, go to Visitors > Geography > Region. Find more details in the video:
Availability
This feature went live on April 25th. Unless your filter has already been set with a country, you'll only see the global map in the Region view. Adding a country filter will allow you to start using the Region view.