How does it work?
Installation
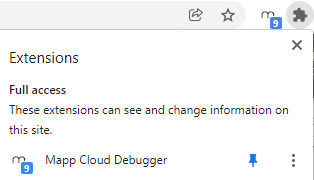
- Download the App from the Google Chrome Store.
- Pin the debugger.
Basic Use
- Go to the site you wish to check tracking on.
- Make sure the Debug Plugin is active.
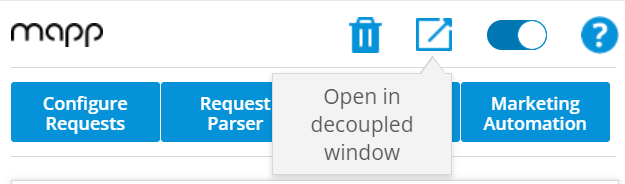
- Click on
 .
.
You may select 
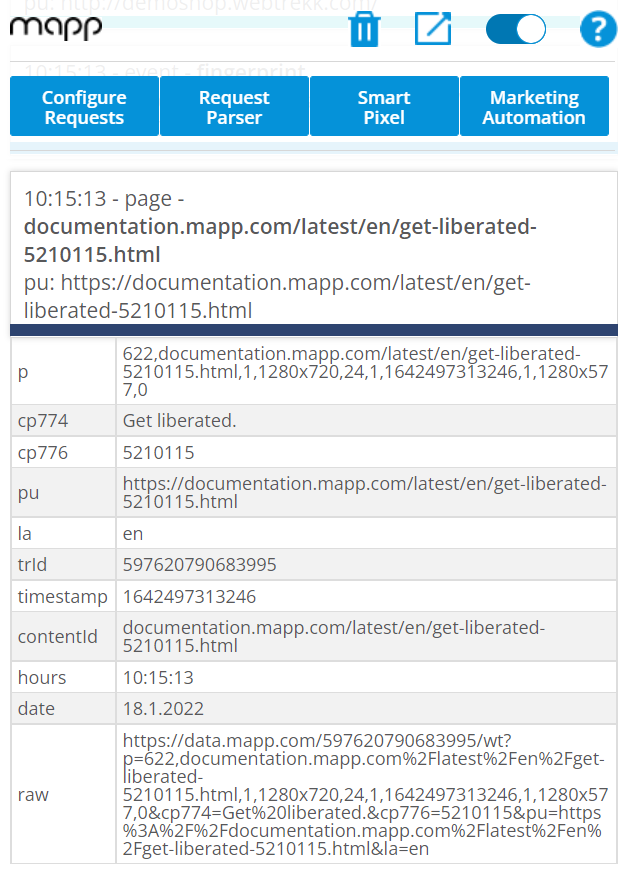
- Here you can see all the available events, written time - type- name.
- Click on the events to see more information.
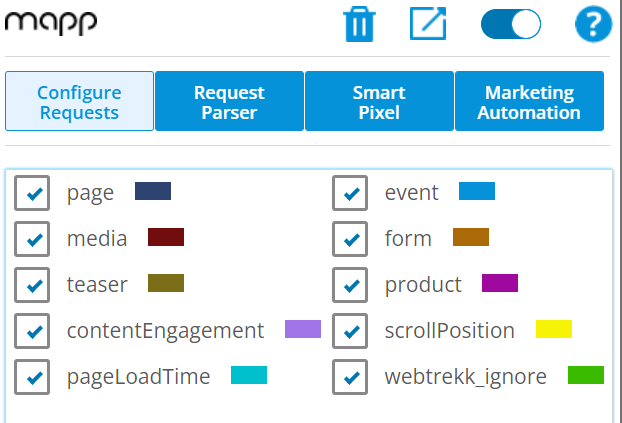
Here you can customize your view. This includes filtering out by selecting a specific parameter and the color code for events.
Request Parser
If you would like to view the information in a table format, or copy it to excel, you can do so in this tab.
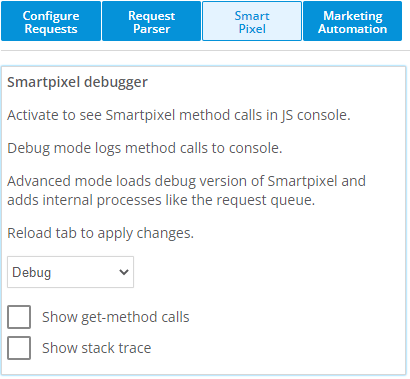
Smart Pixel
Using your developer's console, you can easily see what, where, and when each function is called.
Marketing Automation
If active, you can use this tab to test marketing automations like product recommendations on the page. This includes re-triggering the active campaigns on your page or highlighting them on the page.