Which Predictions are provided by Mapp Intelligence?
Predictions are part of the Mapp AI package and are used to make forecasts based on user behavior.
- What is the likelihood that a specific visitor will never return to the website?
- What is the likelihood that a specific visitor will buy something during one of the subsequent visits?
- What order value will a specific visitor generate with his next order/in the next 30 days/lifetime?
This information is relevant to derive individual marketing measures.
- The costs of marketing measures should not exceed the expected profit.
- Only spend money on customers with high potential!
A self-learning system continuously analyses influences and considers them for calculation.
- The system is configured individually for each customer.
- In the first 2-3 months, in particular, the predictions are automatically adapted on a customer-specific basis.
Various criteria are analyzed:
- Number of visits
- Number of orders
- Purchases/visit
- Visit duration Avg
- Page impressions/visit
- Product views/visit
- Value of product views/visit
- Order value Avg
- Order value
- Days since first/last visit
- Days since first/last purchase
- …
The following prediction metrics and dimensions are available:
Available as | ||||
|---|---|---|---|---|
Metric/ | Label | Description | Metric | Dimension |
Churn Probability | User – Predicted Churn Probability % (interval 10) | Indicates how high the probability is that a visitor will not revisit the website. | X | |
User - Predicted Churn Probability % | X | |||
Conversion Probability | User – Predicted Conversion Probability % (interval 10) | Indicates how high the probability is that a visitor will buy during one of the subsequent visits. | X | |
User – Predicted Conversion Probability % | X | |||
Order Value | User – Predicted Order Value Next 30 Days | The predicted order value that a user will generate in the next 30 days. | X | |
User – Predicted Next Order Value | The predicted order value that a user will generate in his next order. | X | ||
Customer Lifetime Value | User – Predicted Customer Lifetime Value (interval 50) | The predicted order value that a user will generate in addition to the already measured order value. | X | |
User – Predicted Customer Lifetime Value | X | |||
- To calculate the churn probability, all needed is for each page to be tracked in Mapp Intelligence.
- To calculate the other probabilities, orders, and products have to be measured as well.
Calculating the churn probability
Example:
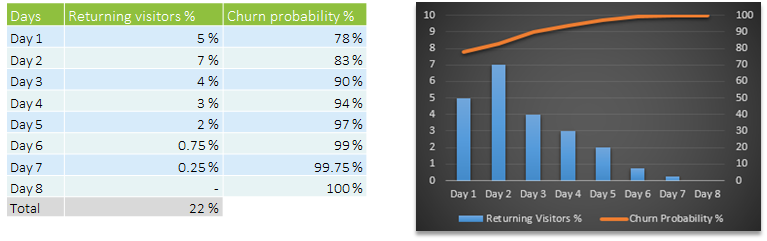
Day 1
Five percent of visitors return to the website on the day of the first visit.
The churn probability on day 1 is: 100 % – sum of all returning visitors (Day 1 – Day 8) = 100 % - 22 % = 78 %
Day 2
Seven percent of visitors return to the website one day after the first visit.
The churn probability on day 2 is: 100 % – sum of all returning visitors (Day 2 – Day 8) = 100 % - 17 % = 83 %
The overall churn probability considers when visitors were last active on the website.
Individual behavior patterns are now considered in the calculation.
For example:
- Visit duration Avg
- Page impressions / visit
- Number of visits
- …
For example, if there were ten page impressions during the first visit, only visitors with a similar number of page impressions would be included in the calculation.