KPIs: Capturing the Net Promoter Score (NPS)
This article shows you, how you activate and configure the Net Promoter Score plugin in Mapp Tag Integration. Furthermore, possible analyses in Mapp Intelligence are shown.
Net Promoter Score (NPS)
The Net Promoter Score (NPS) is a correlated key figure and is suitable for depicting the success of a company. Through a survey the NPS is determined, which can be displayed with Mapp Tag Integration.
The share of promoters (supporters) and detractors (critics) are measured by asking a representative group of customers the following question: "How likely are you to recommend company/brand X to a friend or colleague?"
Responses are measured on a scale from 0 (unlikely) to 10 (very likely). Customers are labeled as promoters if they have answered 9 or 10 and as detractors if they have answered 0 to 6. Customers who answered with 7 or 8 are said to be "indifferent".
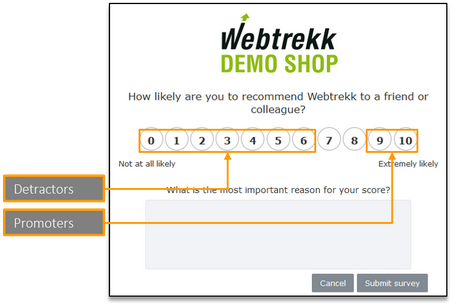
The score is calculated as a percentage by measuring the number of promoters and detractors. This value has a maximum of +100% and a minimum of -100%. 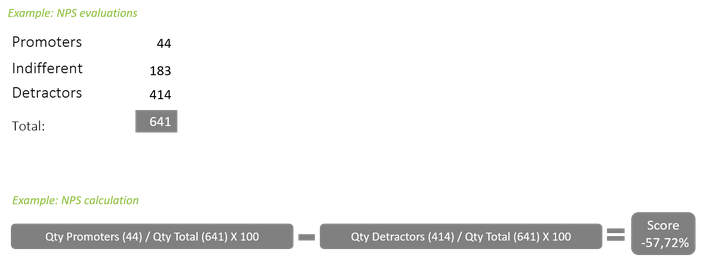
Preconfiguration
The following requirements must be met:
- Mapp Tag Integration must be implemented.
- At least 1 spare session parameter must be available.
- At least 1 spare URM category must be available.
- At least 1 spare custom formula, in order to calculate the average NPS.
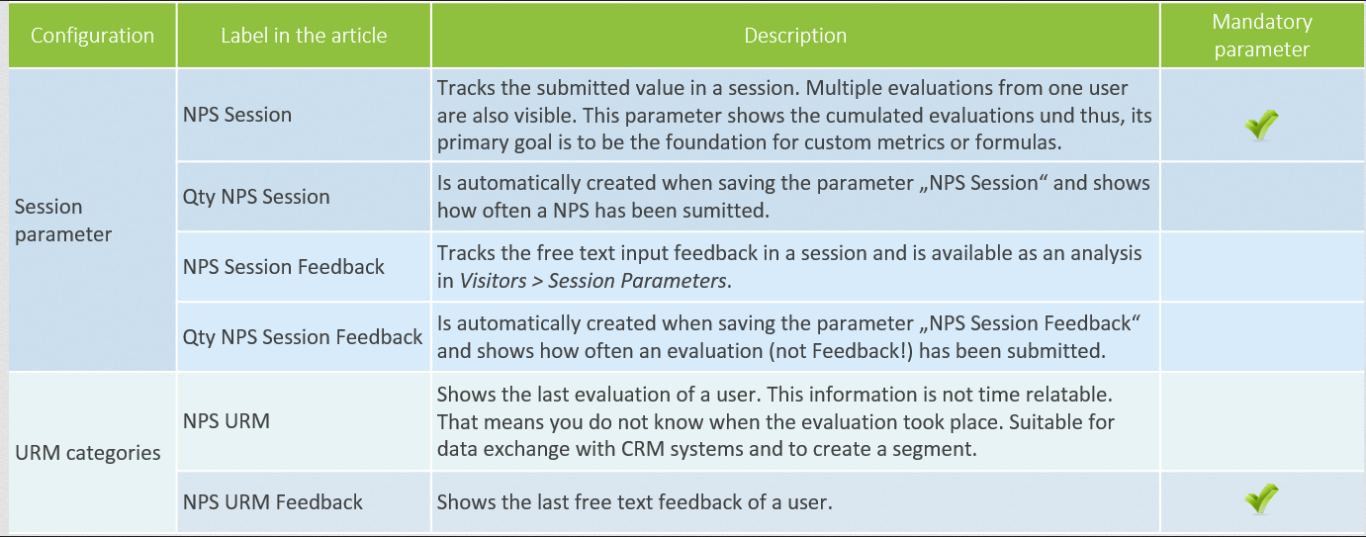
Configuration for the data collection
The following categories and parameters are filled through the NPS plugin and are set up in this article:
Configuration for later analyses
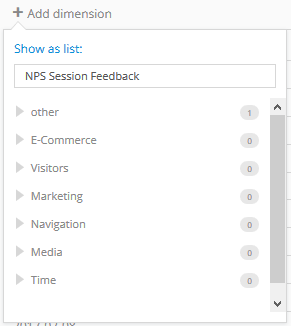
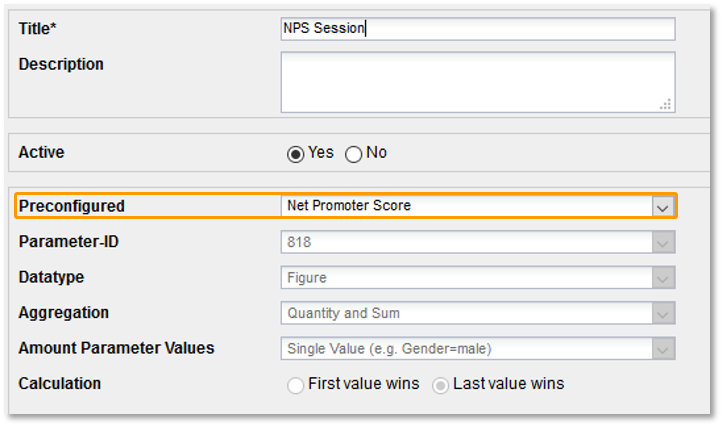
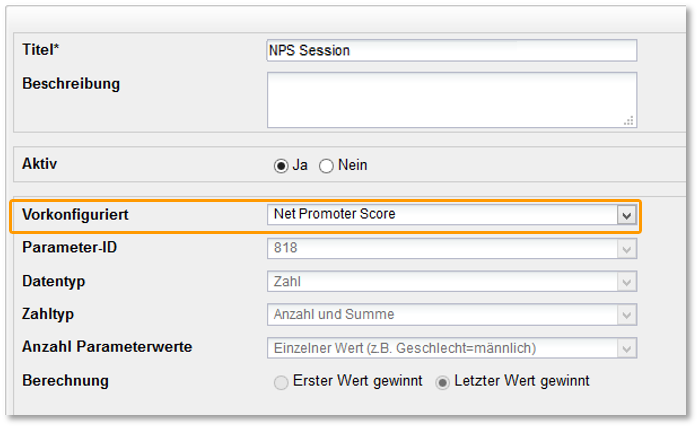
Creating custom parameters
NPS and NPS comments can be tracked through a session parameter. These can be analyzed later.
- The creation of a parameter is done at Mapp Q3 > Configuration > Custom Parameters > Session Parameter > Create New Custom Parameter.
- Select "Net Promoter Score" and "NPS Feedback" as "Preconfigured" and choose an appropriate title for both parameters.
Creating a URM category
NPS and NPS comments (optional) can be tracked through a URM category. They later can be shown for each user. Only the last evaluation can be analyzed.
- The creation of an URM category is done at Mapp Q3 > Configuration > Categories > URM Categories > New Category.
Metrics and formulas for the score calculation
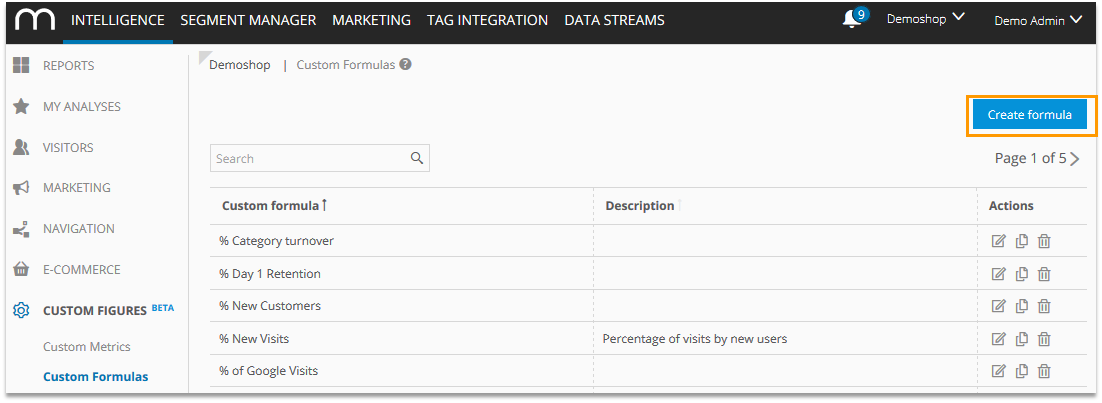
For the final score calculation and for easier analysis, you should set up your own metric and formula in Mapp Intelligence.
Creation through Custom Figures > Custom Formula.
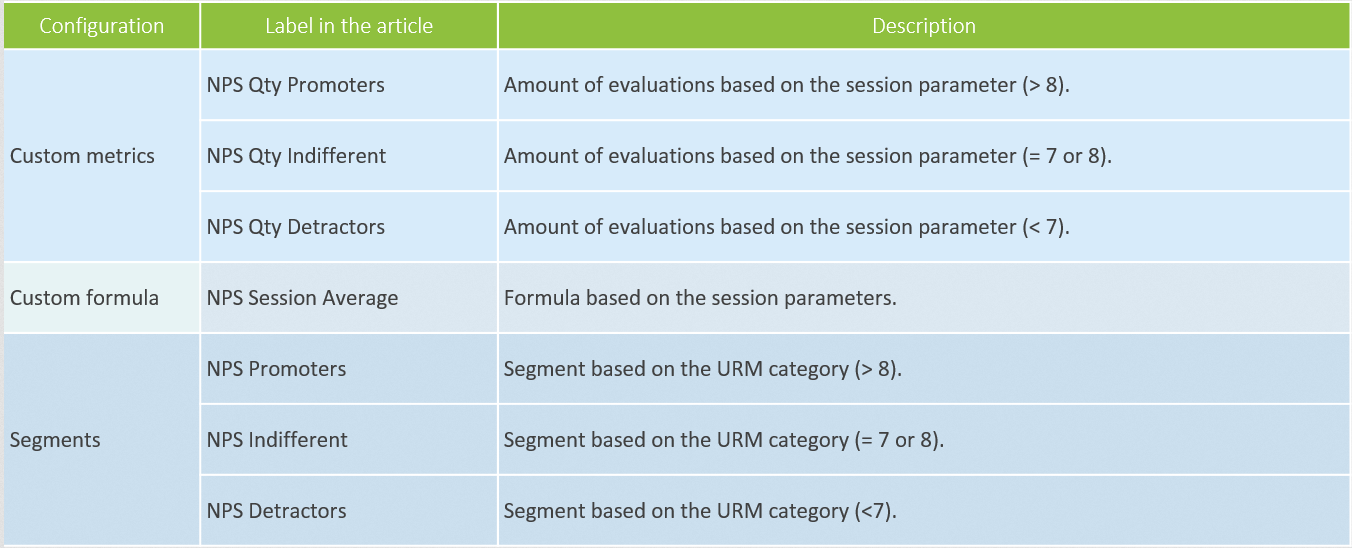
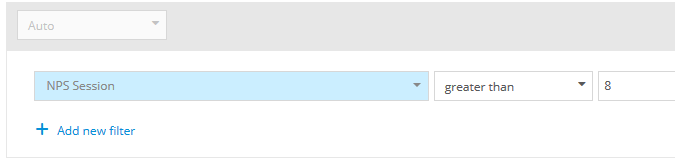
Creating custom metrics
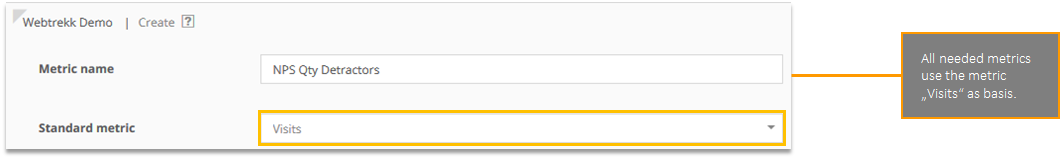
Custom metrics serve as components of the formula and additionally it is also possible to add them to any analysis. The filtering happens through a session parameter.
NPS Qty Promotors
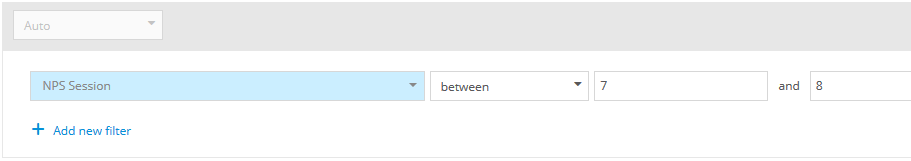
NPS Qty Indifferent
NPS Qty Detractors
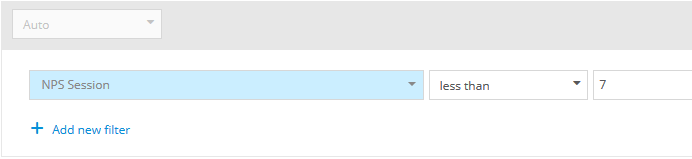
Example: Custom metric on "Visits" basis
Formula for the score calculation
With help of the just created metrics you can now create the formula:
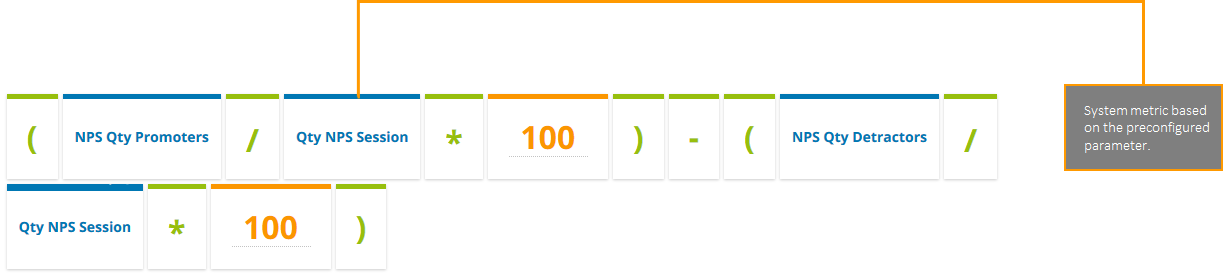
The completed formula should if necessary be released for other logins in the user management. More information on the creation of custom formulas can be found in the training document Custom Figures.
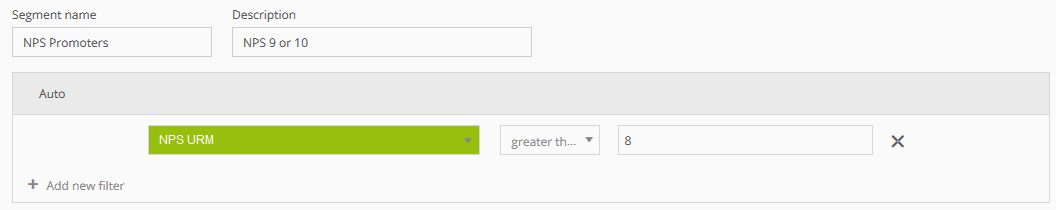
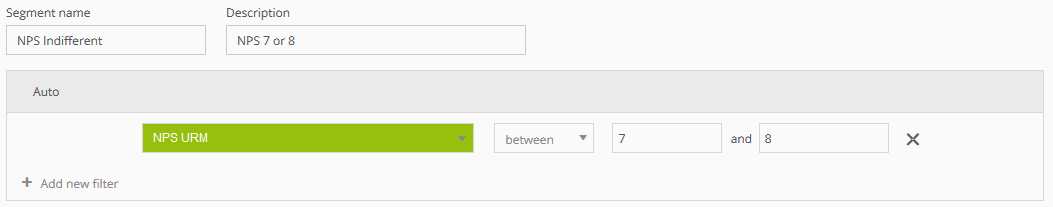
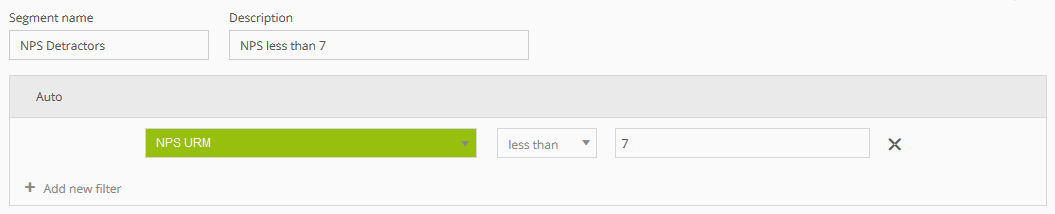
Creating segments based on the URM category
So that users can easily be analyzed and e.g. with help of Mapp Marketing automation targeted, you should create segments based on the URM category. Create own segments through Mapp Segment Manager > Create new segment.
Mapp Tag Integration
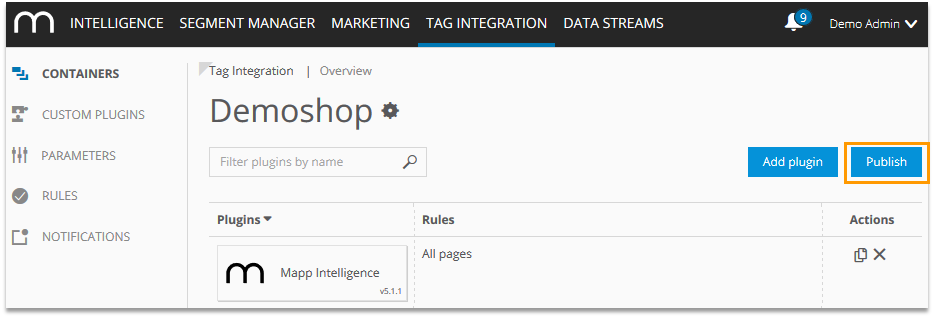
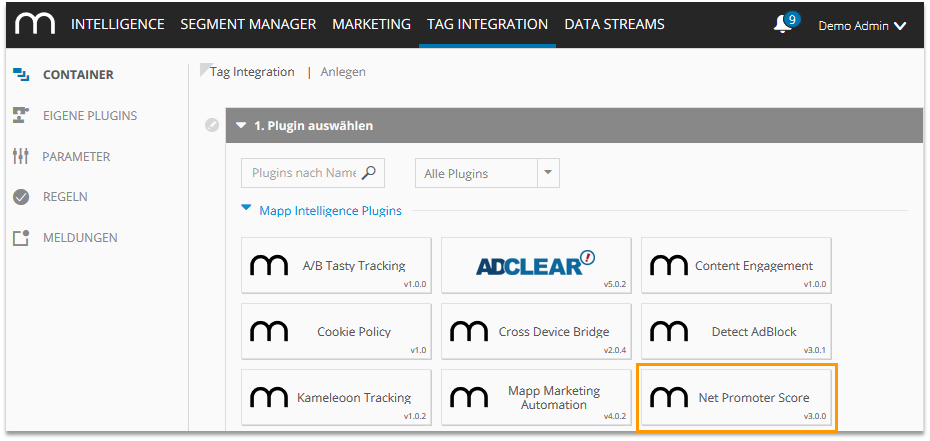
Adding the Net Promoter Score plugin to a container
In Tag Integration, you can add the "Net Promoter Score" Plugin. Click on Tag Integration, choose a container, and click on Add Plugin:
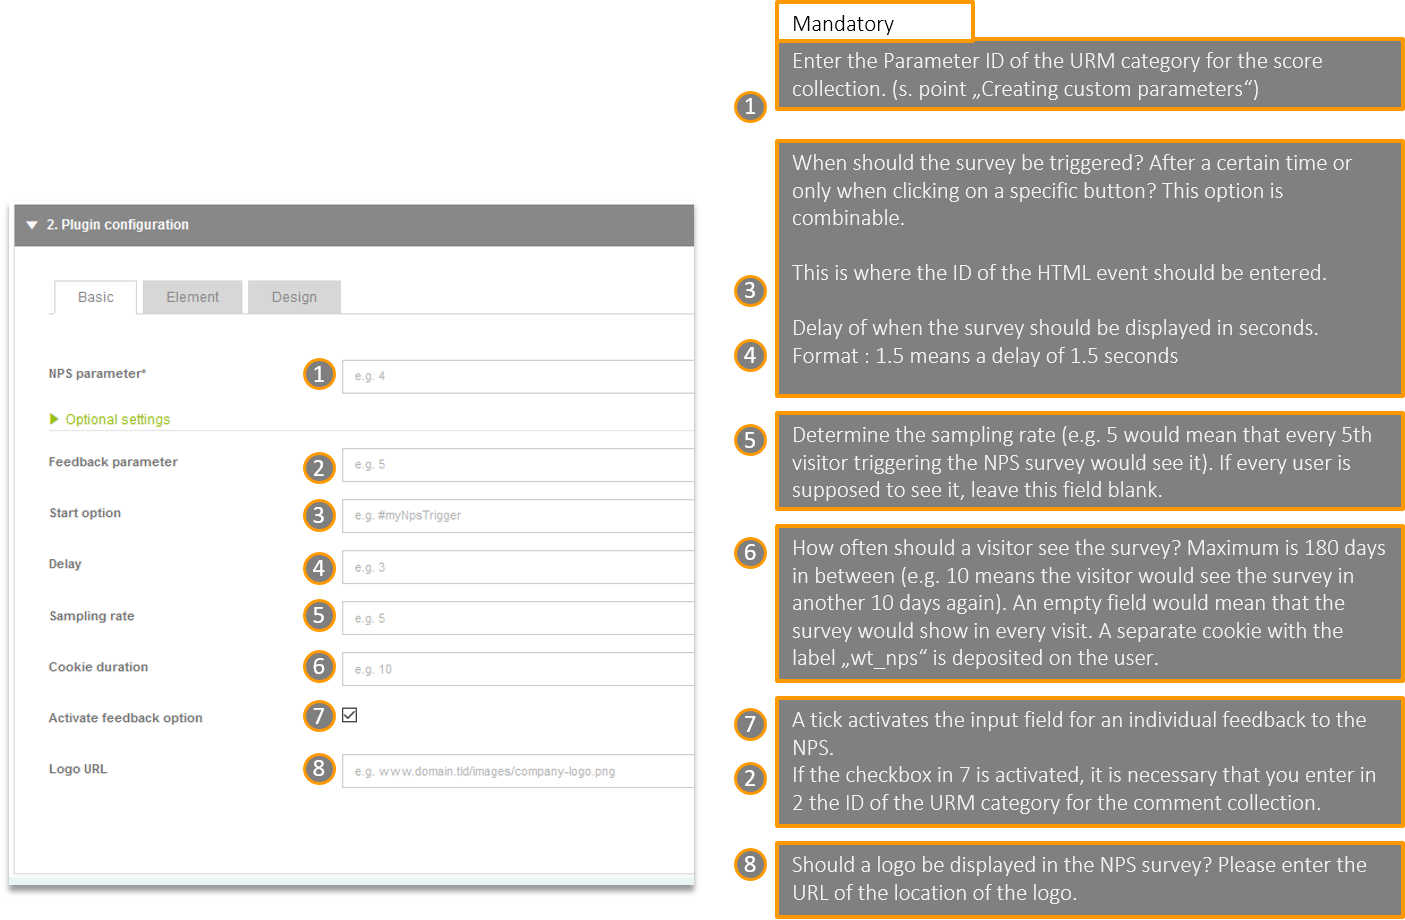
Configuration Basic
Determine the categories in the basic settings as well as further detailed settings regarding the properties of the NPS survey.
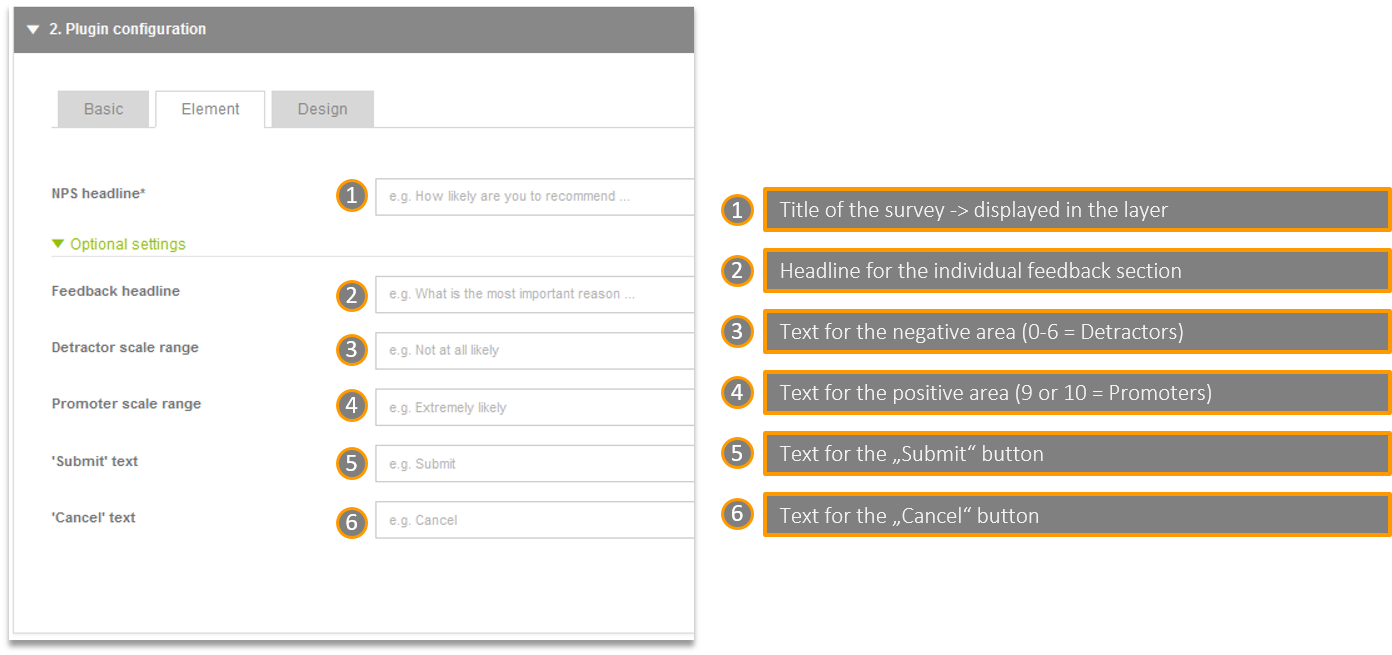
Configuration Element
Determining the elements and their content to be shown.
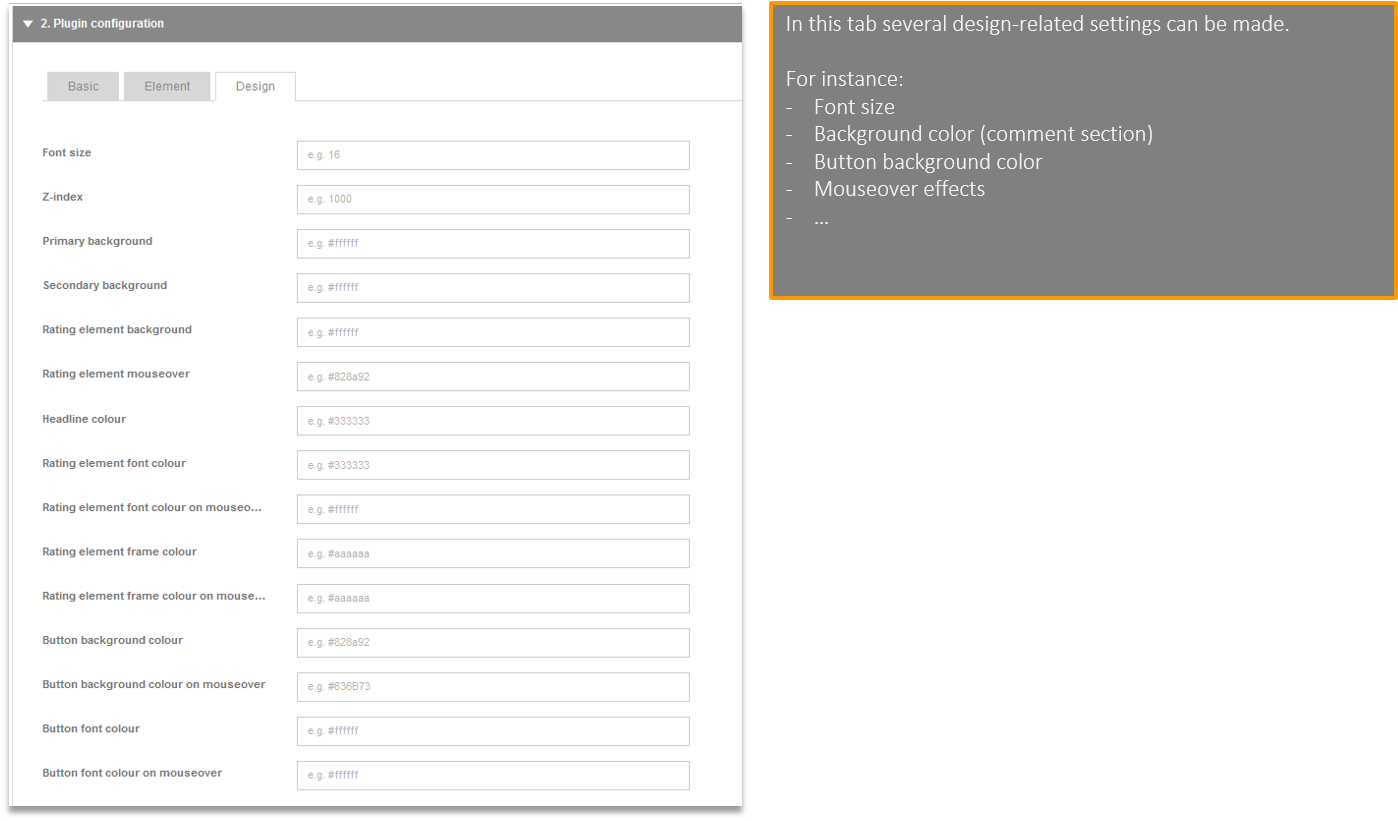
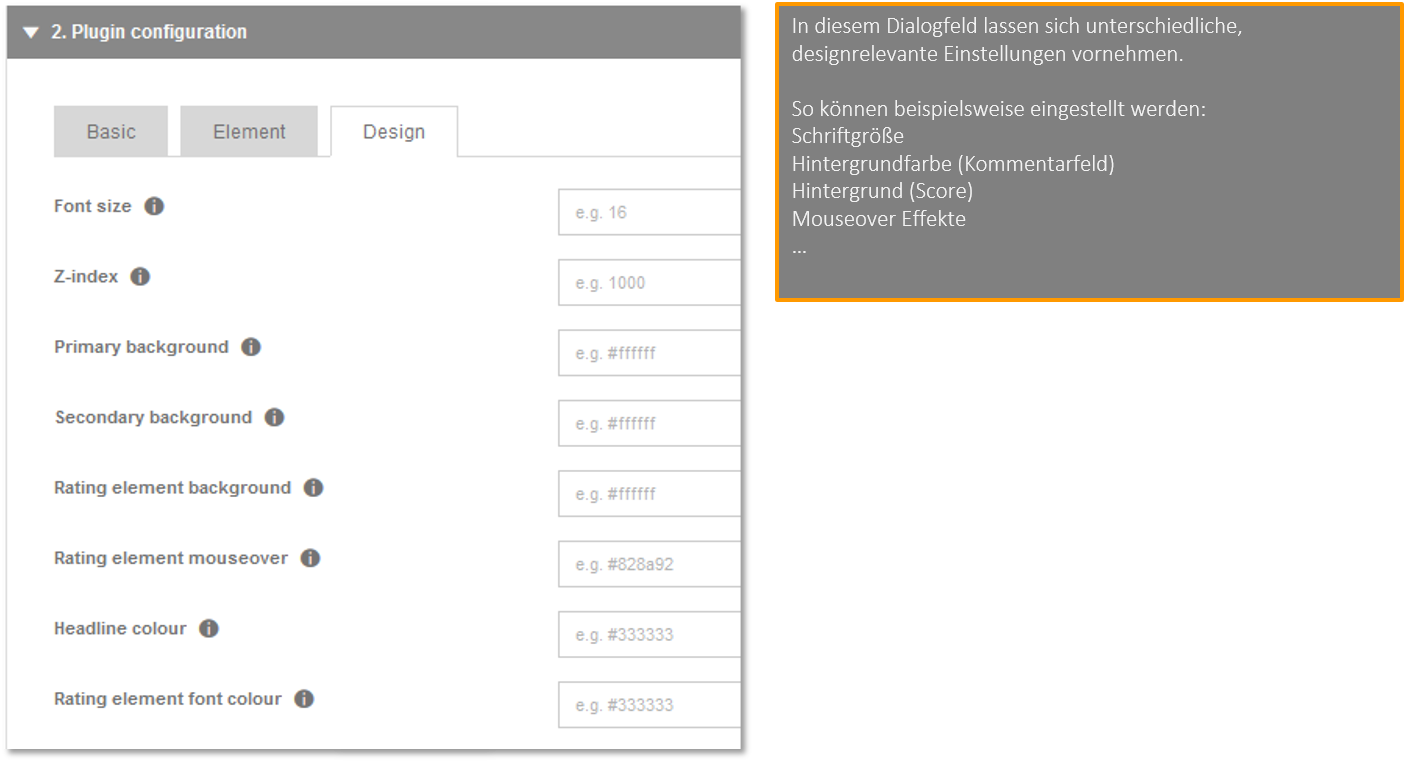
Configuration Design
Configuring the visualization (design).
Rules
On which pages should the plugin be activated?
Analysis in Mapp Intelligence
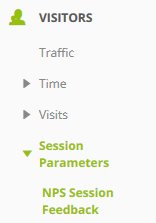
What are the session parameters and URM categories for?
- Session parameters are suitable for time-related analyses. Also, multiple evaluations of a user are visible.
e.g. "How did the NPS behave within the last 12 months?" - URM categories solely show the last evaluation of a user
e.g. "Which users belong to our promoters?"
Calculation example
On January 30 there were 4 evaluations:
- Evaluation 1: NPS = 5
- Evaluation 2: NPS = 8
- Evaluation 3: NPS = 8
- Evaluation 4: NPS = 7
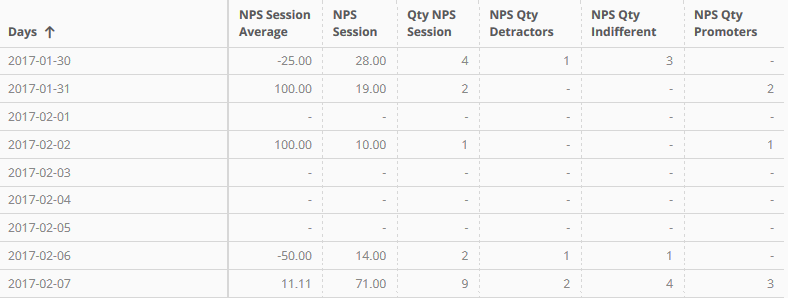
In an analysis you would see the following data:
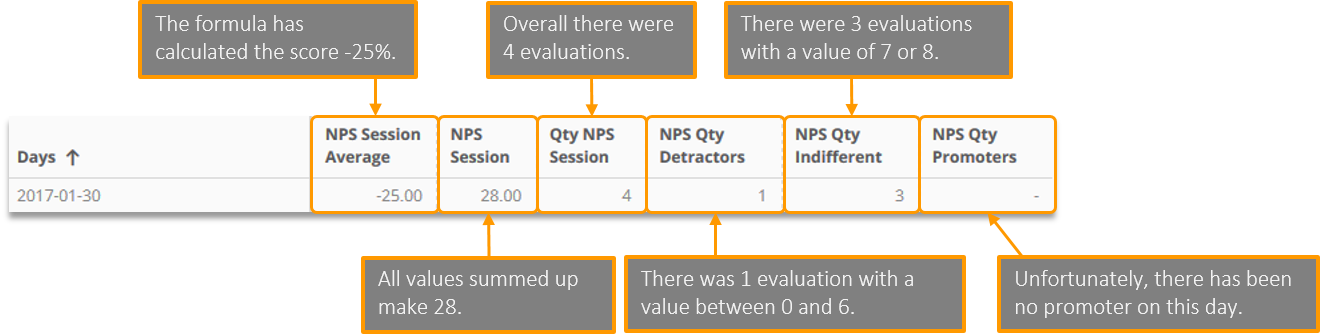
Evaluation per day based on the session parameter
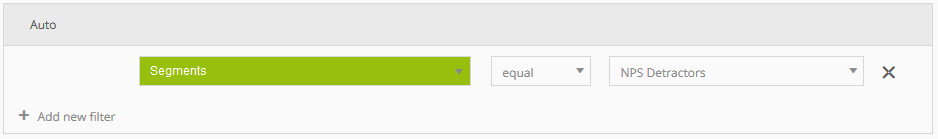
Filtering of analyses with segments based on URM categories
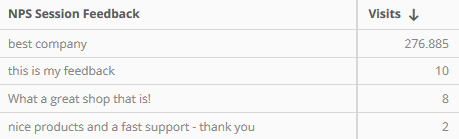
Evaluation of the individual free text input