This article shows you, how you can integrate return information.
Return information can be tracked via an e-commerce parameter. The matching is done based on an order ID, that is transmitted to Mapp. Usually, it is transmitted every day automatically, which value per order number was returned.
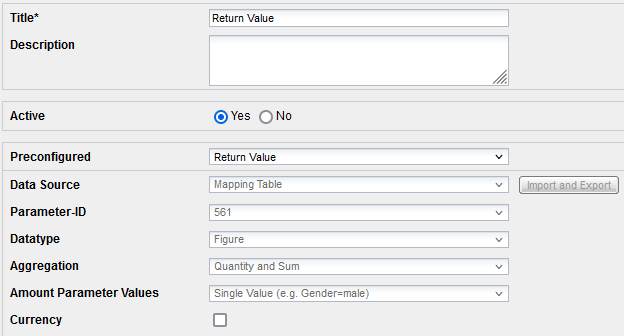
Prior to the upload a custom parameter has to be set up for tracking the return value.
This can be done at Mapp Q3 > Configuration > Custom Parameters > E-Commerce Parameter > Create New Custom Parameter.
Use the following setup:
Usually, the import of the return information is done automatically via data feed or JSON.
In this example, we show the import via Excel. This is often done as a first step in order to understand and check the working principle.
in order to have the correct import format, we first export the order numbers and the parameter.
For doing so click on "Import and Export" in the configuration layer of the e-commerce parameter and then on "Export".
Please note: The function "Import and Export" is only available after the parameter was saved and is available in Mapp Intelligence. Perhaps this could take some minutes. |
|---|
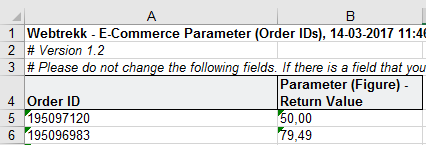
You have to insert the order IDs, that were returned, in the column "Order ID". The value of each returned order has to be inserted into the parameter column.
Example: A customer orders 2 products for 100 Euros each. The total order value was 200 Euros. One product was returned, therefore the return value is 100 Euro.
Save the file and upload it again via the import tab.
| Please note, that it can take some time (usually 60 minutes) for the import to be processed. |
|---|
Documentations about the data import via data feed or JSON can be found in the Developer section.
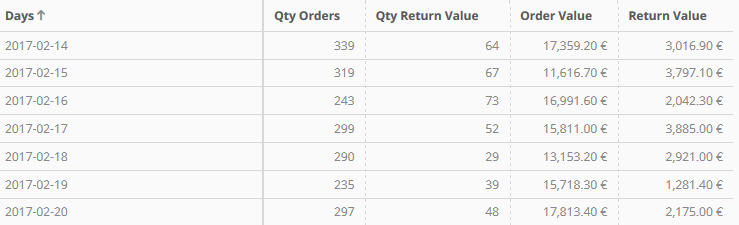
The imported return data can be used in the analyses in Mapp Intelligence.
2 metrics are available:
includes the monetary value, that was returned. Therefore, it is the counterpart to "Order Value".
shows the number of times returns happened. Therefore, it is the counterpart to "Qty Orders".
The date and time of the order are assigned to both metrics.
A simple analysis could look like this:
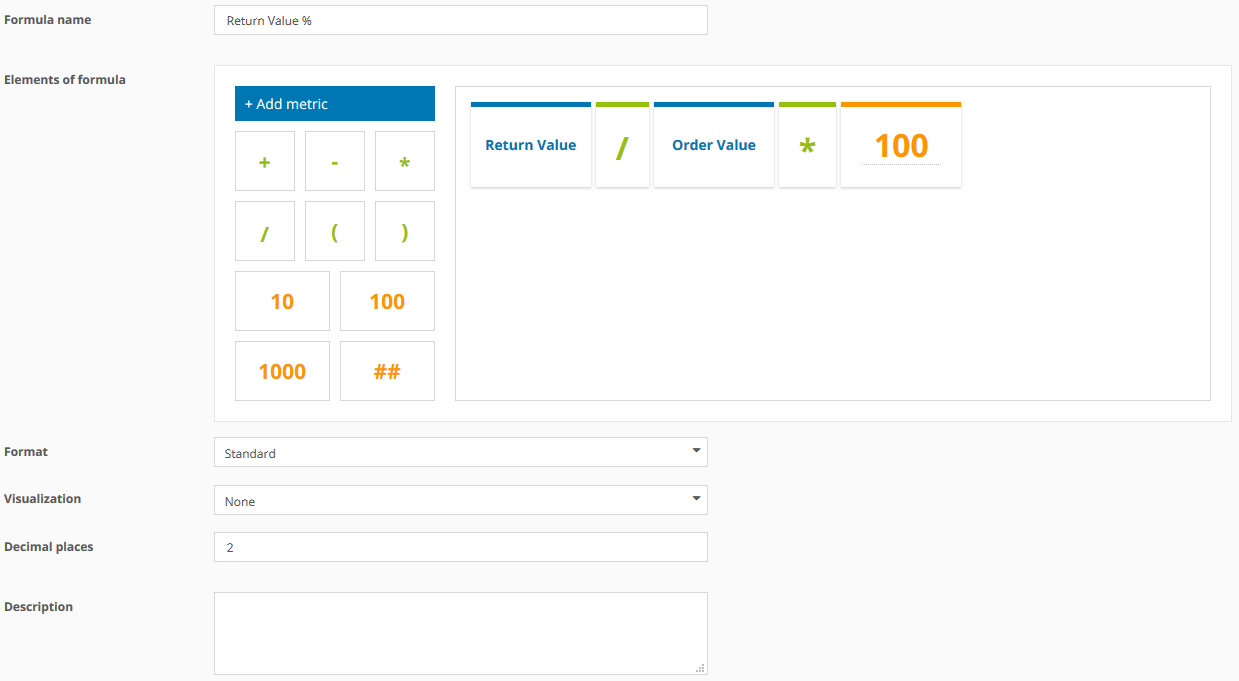
Further interesting metrics can be set up individually as a custom formula (Custom Figure > Custom Formula > New Custom Formula):
- shows what percentage of the order value was returned.
- shows what percentage of the orders were returned.

- shows the order value minus the return value.

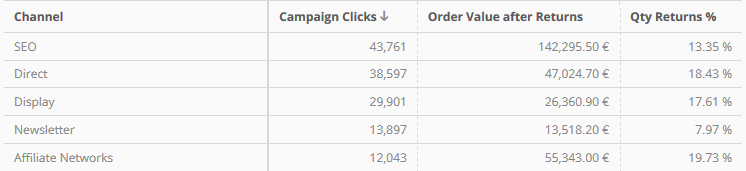
These metrics are often used in campaign analyses: