Analyses 2 – Basic Metrics
This training chapter shows, how important metrics are being calculated.
1 Basic Metrics Time Analysis
The examples in this section contain the following metrics:
- Visitors
- Visits
- Page Impressions
- Page Impressions per Visit
- Duration
- Visit Duration Avg
- Browsers, Unique
- Entries
- New Visits
- New Visit Rate %
- Active Users, daily (DAU)
A user opened the following pages on June 26: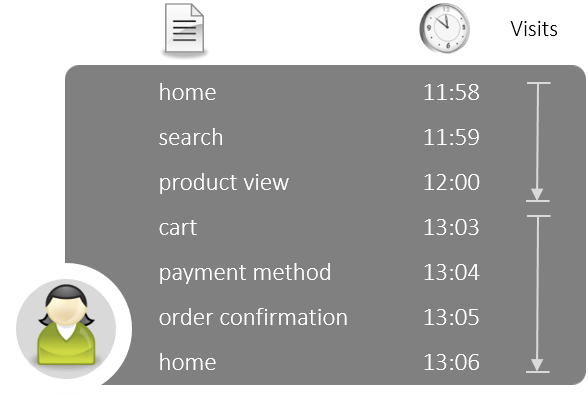
Analysis: Visitors > Traffic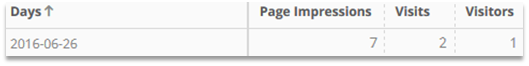
| Page Impressions | Access of a single page. |
| Visits | Starts as soon as the first Page Impression/Click on a website is detected. Ends after 30 minutes of inactivity. |
| Visitors | Starts as soon as the first Page Impression/Click on a website is detected. Unique counting/once per time interval (e.g. Day/Week/Month). Recognition by cookies and – if provided – CustomerID. |
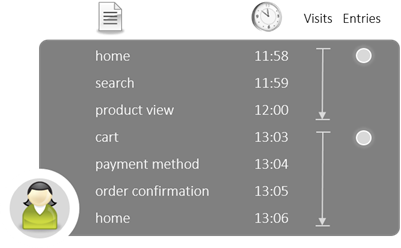
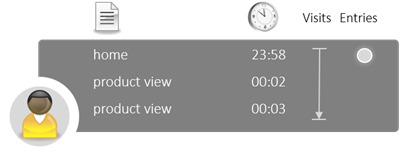
2 users visited the following pages on June 26/27:
Analysis: Visitors > Time > Month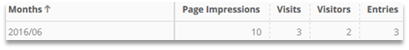
Analysis: Visitors > Time > Days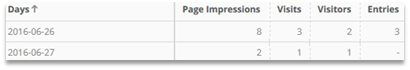
| Visits | Describes the duration of time from the entry to the exit. |
| Entries | Refers to the date on which the visit started. |
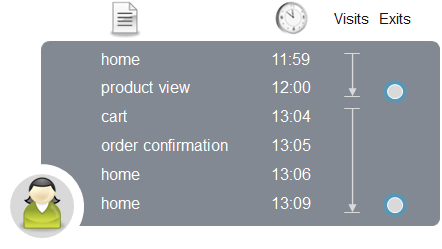
A user opened the following pages on June 26:
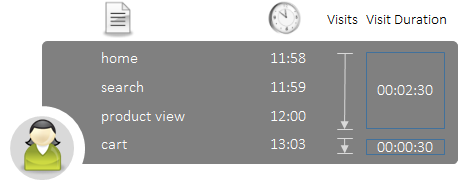
Analysis: Visitors > Traffic
| Page Impr. per Visit | The average number of Page Impressions per Visit. |
| Visit Duration Avg | The average duration of a visit. 30 seconds are used as a default value for the exit page. If a link is clicked on the exit page, the time until the click of the link is also considered. Event requests generated by Mapp Intelligence Plugins (e.g. the content engagement Plugin) are also taken into account. |
2 users performed the following visits on February 13 and 14:
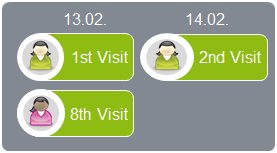
Analysis: Visitors > Traffic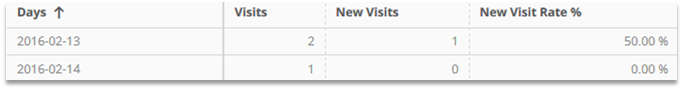
| New Visits | The number of first visits. |
| New Visit Rate % | The ratio of first visits compared to the total visits. |
By handing over an unique user ID a user can be identified even when he uses different devices and browsers or deletes his cookies.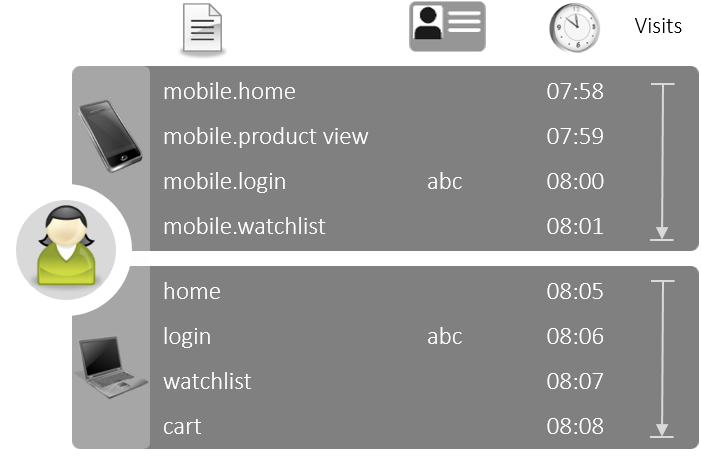
Analysis: Visitors > Traffic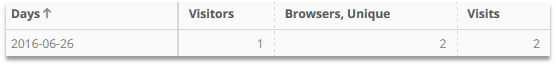
| Visitors | Shows the cross-browser and cross-device unique number of users. This requires login information to be passed (CustomerID). |
| Browsers, Unique | The number of browsers and devices used. Recognition by cookies. |
| Visits | Always calculated on a per-browser and per-device basis. |
The following pages were opened on June 26. A login is performed twice in the same browser using different user accounts.
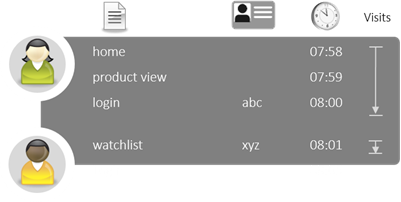
Analysis: Visitors > Traffic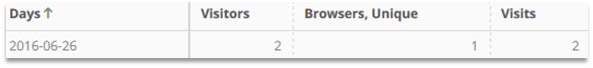
As soon as a different CustomerID is sent during a visit, a new visitor and visit are measured.
| Extensive information on cross-device visitor recognition can be found in the training chapter User Centric Tracking. |
|---|
By using engagement metrics it is possible to analyze the long-term usage behavior by day.
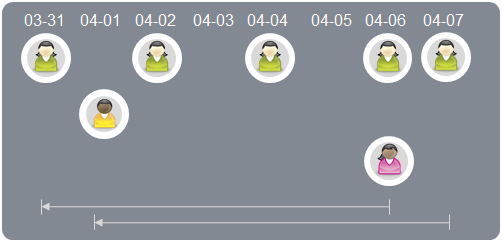
Analysis: Visitors > Engagement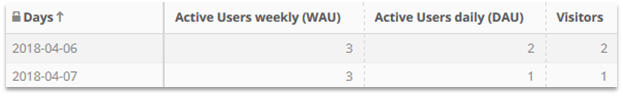
| Active Users weekly (WAU) | The amount of unique visitors within the last 7 days. |
| Active Users daily (DAU) | The amount of unique visitors on the respective day. It equates the “Visitors”. |
2 Basic Metrics Pages Analysis
The examples in this section contain the following metrics:
- Visitors
- Visits
- Page Impressions
- Page Duration Avg
- Entries
- Exits
- Exit Rate %
- Bounces
- Bounce Rate %
A user performed the following visits:

Analysis: Navigation > Pages > Pages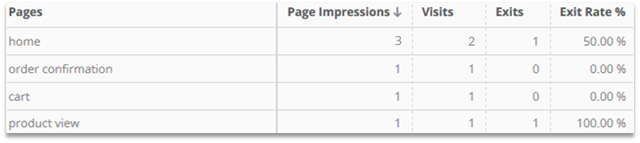
| Page Impressions | How often was the site accessed? |
| Visits | In how many visits the page was accessed at least once? |
| Exits | How often was a page the last page of a visit? |
Exit Rate % | How was the ratio of exits compared to the visits? |
A user performs the following visits:
Analysis: Navigation > Pages > Pages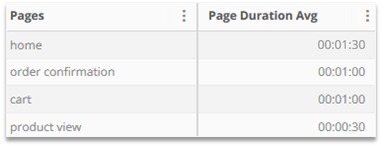
| Page Duration Avg | How much time passed on average until the next page was viewed? 30 seconds are used as a default value for the exit page. If a link is clicked on the exit page, the time until the click of the link is also considered. Event requests generated by Mapp Intelligence Plugins (e.g. the content engagement Plugin) are also taken into account. |
A visitor performed the following visits:
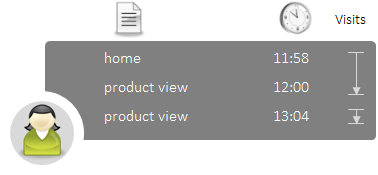
Analysis: Navigation > Pages > Pages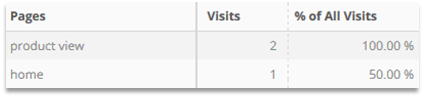
| % of All Visits: | What‘s the share of visits in which a page was viewed? |
A visitor opened the following pages on June 26:
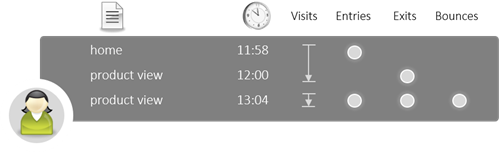
Analysis: Navigation > Pages > Pages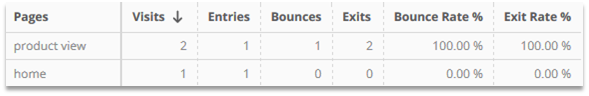
| Visits | In how many visits the page was accessed at least once? |
| Entries | How often was the page the first page of a visit? |
| Bounces | How often only this single page was accessed during a visit? |
| Exits | How often was the page the last page during a visit? |
| Bounce Rate % | The ratio of bounces compared to the entries. |
| Exit Rate % | The ratio of exits compared to the visits. |
3 Basic Metrics Campaign Analysis
The examples in this section contain the following metrics:
- Campaign Clicks
- Visits
- Visitors
- Bounce Rate %
- Visit Duration Avg.
- Assists
- Assists, Unique
- Campaign Lifecycle Contacts
- Contacts in Customer Journey, Unique
- Conversions
- Conversion Initiator
- Conversion Initiator %
- Conversion Supporter
- Conversion Supporter %
- Conversion Transformer
A user accesses the following pages via the depicted campaigns:
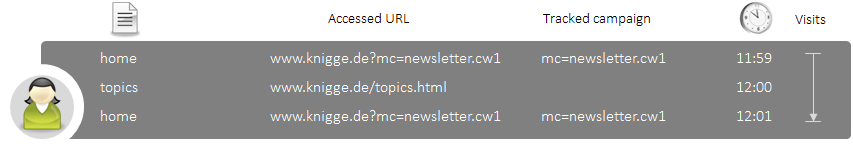
Analysis: Marketing > Campaigns > Advertising Media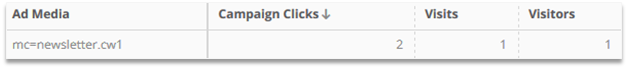
| Campaign Clicks | How often was the data source of a campaign measured? |
| Visits | In how many visits a campaign was tracked? |
| Visitors | How many visitors used a campaign in the selected time period? |
A user accesses the following sites via the depicted campaigns:
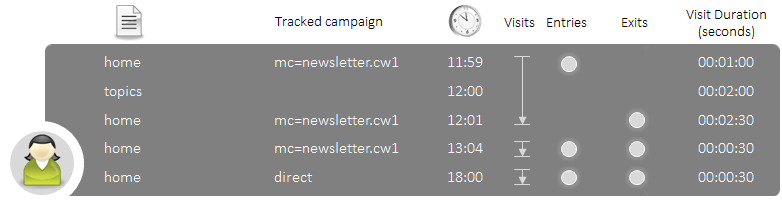
Analysis: Marketing > Campaigns > Advertising Media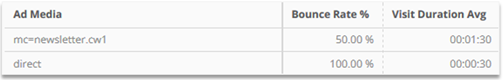
| Bounce Rate % | What was the share of bounces compared to the entries when a campaign was measured during the visit? |
| Visit Duration Avg | How long was the average duration of a visit in which a campaign was measured? |
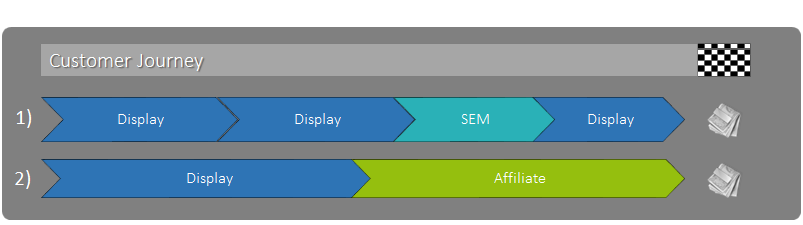
2 Customer Journeys were measured. The standard attribution is "last campaign wins".

Analysis: Marketing > Campaign Categories > Campaign Channel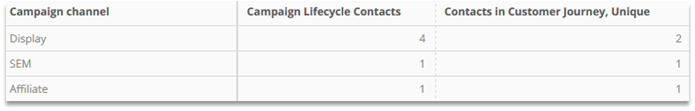
| Campaign Lifecycle Contacts | How many campaign contacts took place in the analyzed Customer Journeys? |
| Contacts in Customer Journey, Unique | In how many Customer Journeys were campaign contacts measured? |
| Further information on campaign analysis can be found in the training chapter Campaign Analyses. |
|---|
2 Customer Journeys were measured. The standard attribution is "last campaign wins".
Analysis: Marketing > Campaign Categories > Campaign Channel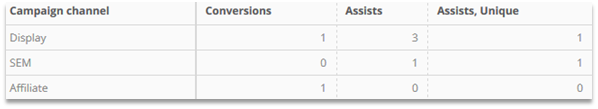
| Conversions | How many conversions were assigned to the campaign? |
| Assists | How many campaign contacts were measured, for which no conversion was assigned |
| Assists, Unique | How often was the campaign a part of the Customer Journey, but no conversion was assigned to it? |
2 Customer Journeys were measured:
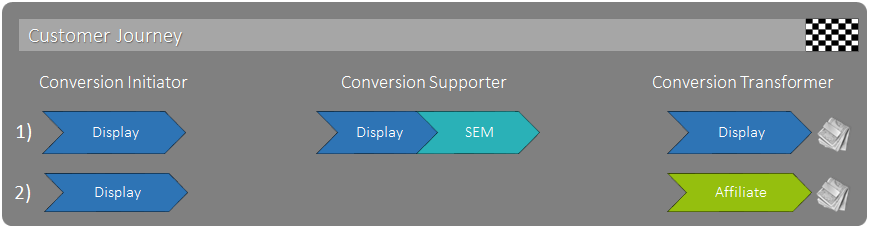
Analysis: Marketing > Campaign Categories > Campaign Channel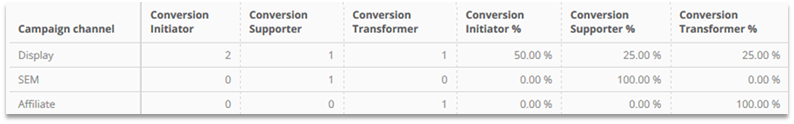
| Conversion Initiator | How often was the campaign the first contact within the Customer Journey? |
| Conversion Supporter | How often was the campaign neither the first nor the last contact within the Customer Journey? |
| Conversion Transformer | How often was the campaign the last contact within the Customer Journey? |
| Conversion Initiator % | What percentage of all its accesses was made as first contacts? |
| Conversion Supporter % | What percentage of all its accesses was made neither as first nor as last contacts? |
| Conversion Transformer % | What percentage of all its accesses was made as last contact? |
4 Basic Metrics E-Commerce Analysis
The examples in this section contain the following metrics:
- Qty Product Views
- Qty Purchased Products
- Qty Abandoned Products
- Add to Shopping Cart Rate %
- Product Conversion Rate
- Value Purchased Products
- Abandoned Product Value
- Shopping Cart Abandonment Rate %
- Order Value
- Conversion Rate %
A user performed the following visits on February 13 and 14:
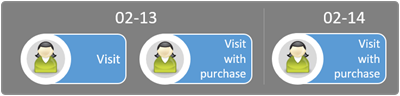
Analysis: Visitors > Traffic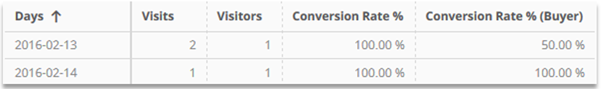
| Visits | How many visits were performed? |
| Visitors | How many visitors visited per day? |
| Conversion Rate % | What percentage of visitors did also purchase? |
| Conversion Rate % (Buyer) | In what percentage of all visits one or more purchases were performed? The expression in brackets is always the name of the depth of engagement with the highest priority. It has to be specifically defined for including a performed purchase. |
A user accessed the following products during one visit:
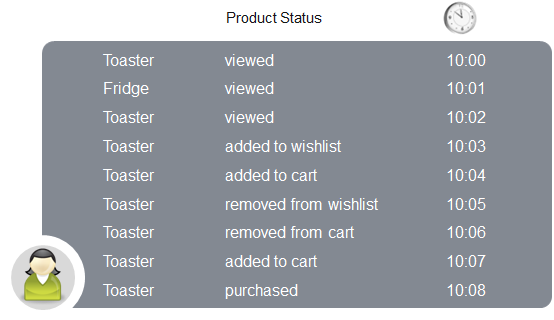
Analysis: E-Commerce > Products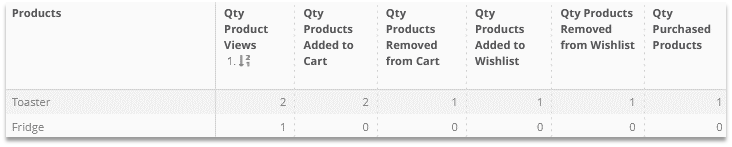 <<
<<
| "Qty" Metric | How often was the product... |
|---|---|
| Qty Product Views | viewed on the product detail page |
| Qty Products Added to Cart | added to the shopping cart |
| Qty Products Removed from Cart | actively removed from the shopping cart |
| Qty Products Added to Wishlist | added to the wishlist |
| Qty Products Removed from Wishlist | actively removed from the wishlist |
| Qty Purchased Products | purchased |
A user accessed the following products during one visit:
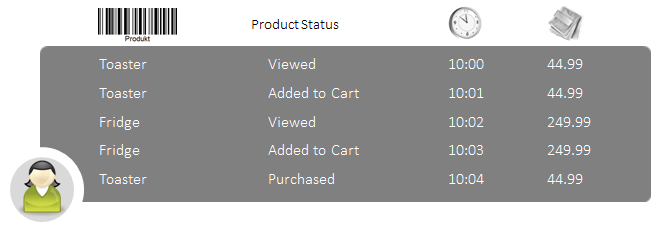
Analysis: E-Commerce > Products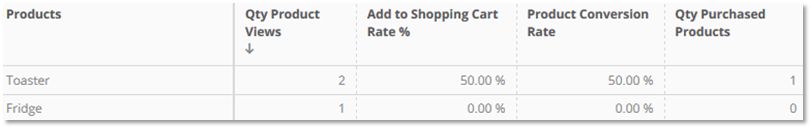
| Qty Product Views | How often was a product viewed? |
| Add to Shopping Cart Rate % | What percentage of the viewed products were added to the shopping cart? |
| Product Conversion Rate | What percentage of the viewed products were purchased? |
| Qty Purchased Products | How often was a product purchased? |
A user accessed the following products during one visit:
Analysis: E-Commerce > Products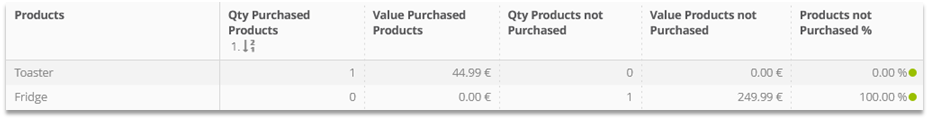
| Value Purchased Products | What was the value of the purchased products? |
| Qty Products not Purchased | How often was a product added to the shopping cart but not purchased during the same visit? |
| Value Products not Purchased | What was the value of the products that were added to the shopping cart but not purchased during the same visit? |
| Shopping Cart Abandonment Rate % | What percentage of products added to the shopping cart was not purchased during the same visit? |
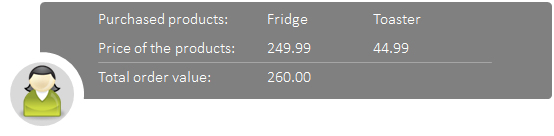
A user purchased the following products:
Analysis: Visitors > Traffic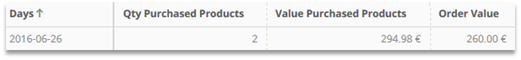
| Qty Purchased Products | How many products were purchased? |
| Value Purchased Products | How much did the purchased products cost in total? |
| Order Value | What order value was generated? |
You should now be able to answers questions like these:
- What are Page Impressions?
- Within a visit, when does the time-out take place?
- How is the page duration for exit pages calculated?
- How does the formula „Exit Rate %“ differ from the formula „Bounce Rate %“? Both formulas are predefined by Mapp Intelligence.