With this release, Webtrekk Analytics provides you with an additional analysis variant by introducing the cross table. The cross table enables you to analyze the relationship between two dimensions in relation to a metric. Imagine you want to find out at what time and on what day of the week your website is visited most frequently. The cross table is the way to answer this question. The visualization also allows a clear presentation at a glance.
More use cases are
Do products (T-shirts, pullovers) in one color sell above average?
How long do readers devote to articles in one section on certain days of the week?
On which day of the week and at what time of the day does my online store see the highest sales?
To determine the values to be crossed, the dimensions are individually related to the selected metric. The calculated values are then displayed in the cross table. To open the Cross Table Analysis view, click the [Cross Table] button.
Cross Table Analysis button
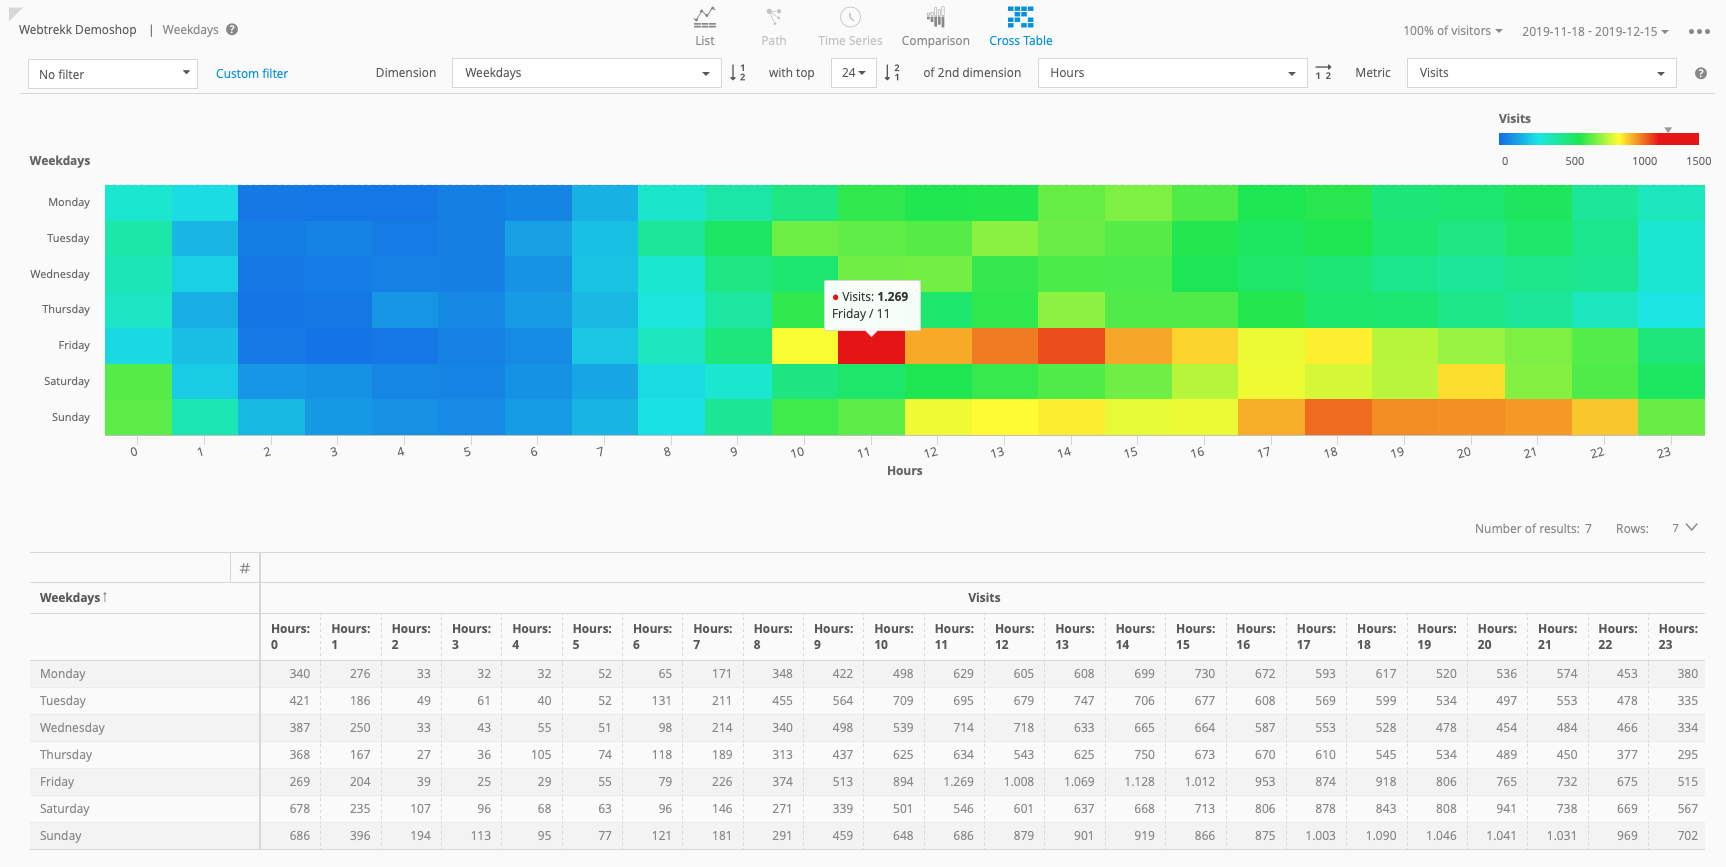
Example: Cross Table Analysis, crossing weekdays and hours.