Stay on top of your Mapp Engage product usage and volumes. Monitor and export KPIs, and use them for reporting. This feature is now available both via a new page in Mapp Engage, and via API.
Key Benefits
Verify system usage and monitor your quotas.
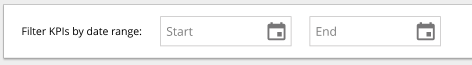
Filter the usage statistics by a specific date range.
Export the system usage statistics in CSV.
Access data via Engage UI, or use API 2.0 methods.
Availability
This feature is available to all Mapp Engage accounts. Contact your account manager if you need support.
How does it work?
To use via API 2.0 methods, set up the API as per the API Documentation. To access via the Engage UI - follow the steps below.
In your Mapp Engage account go to Administration > Usage Statistics
Use the date filter to see the relevant data.
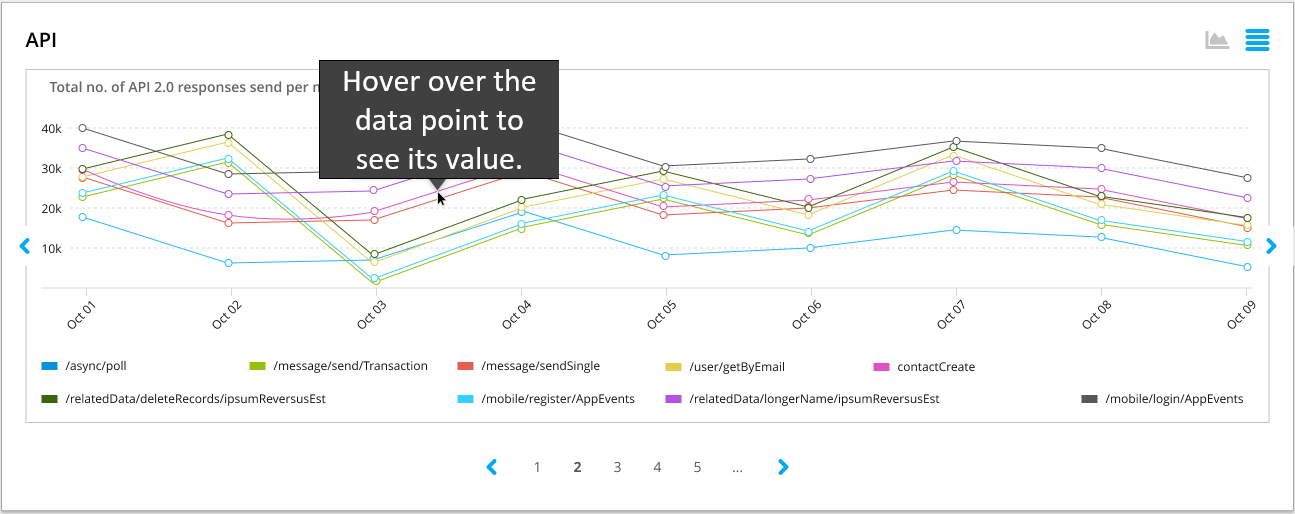
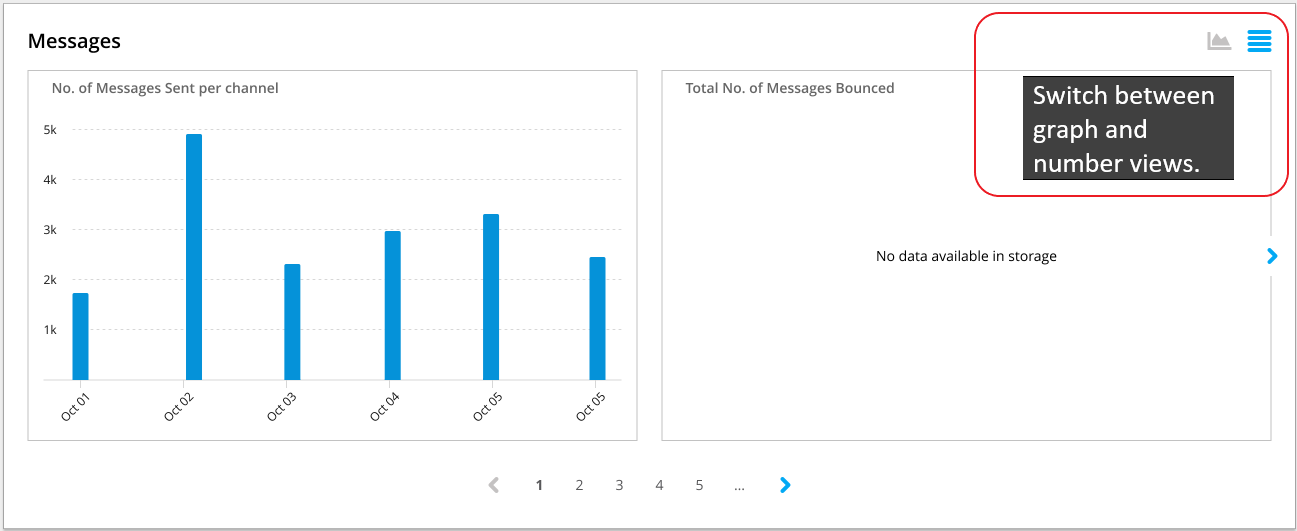
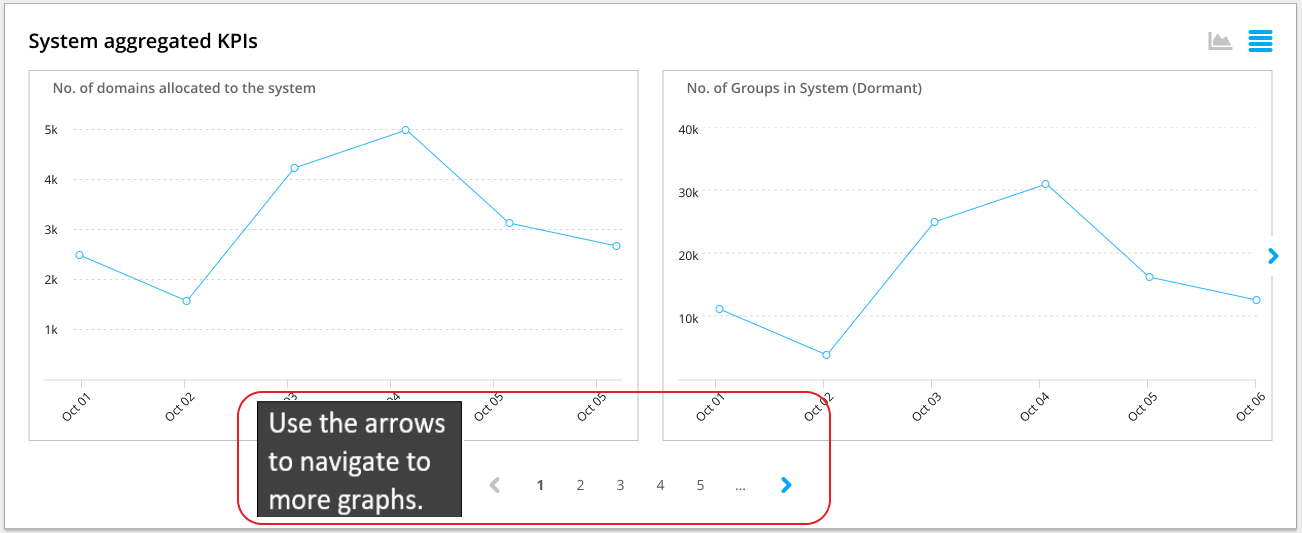
Graphs update according to the dates you select. There is a variety of graph types available to represent your data in a meaningful way.
Examples
You can export your data to a raw CSV file by pushing the Export CSV button.