How long does it take to load specific pages?
Page load time can be an indicator for the availability of websites and possible technical problems.
Mapp provides a plugin that enables this measurement. The plugin is available in Tag Integration, but can be added as separate JavaScript file in the standard pixel. More information can be found here: Page Load Time.
The tracking does not work in Apps and with sites that reload additional content (infinite scroll).
Step 1: Set up the parameter
The parameter, in which the page load time will be saved, has to be defined in Mapp Q3 > Custom Parameters > Event Parameter.
For doing so, choose Create New Custom Parameter and then under Preconfigured Page Load Time.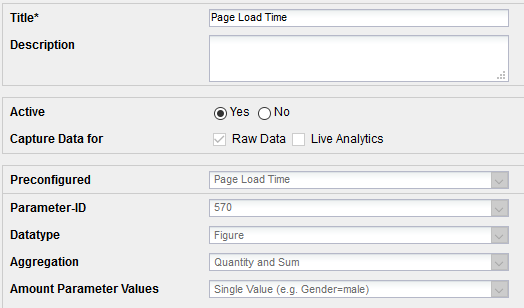
Step 2: Activation in Tag Integration
Integrate the Page load time plugin in the container, in which the website to be tracked is stored. You can choose the Sampling rate in the configuration. By doing so you set, how often the page load time should be tracked:
- 0 or 1 = always
- 2 = for every second page access
- 3 = for every third page access
- ...
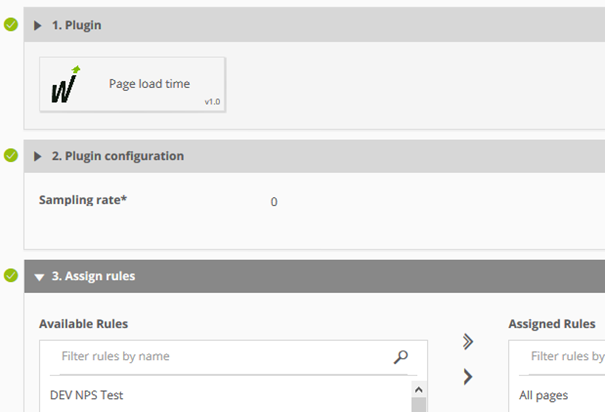
Via "Assign rules" you can specify, in which page areas the tracking should happen.
Step 3: Set up custom metrics and formulas
The value depicted in the metric "Page Load Time" shows the accumulated loading time of all pages in milliseconds. The metric "Qty Page Load Time" shows how often the page load time was tracked. Both are therefore only of limited help for meaningful analyses. As a consequence it is necessary to create a set of custom formulas and metrics. This is done at Custom Figures > Custom Formulas.
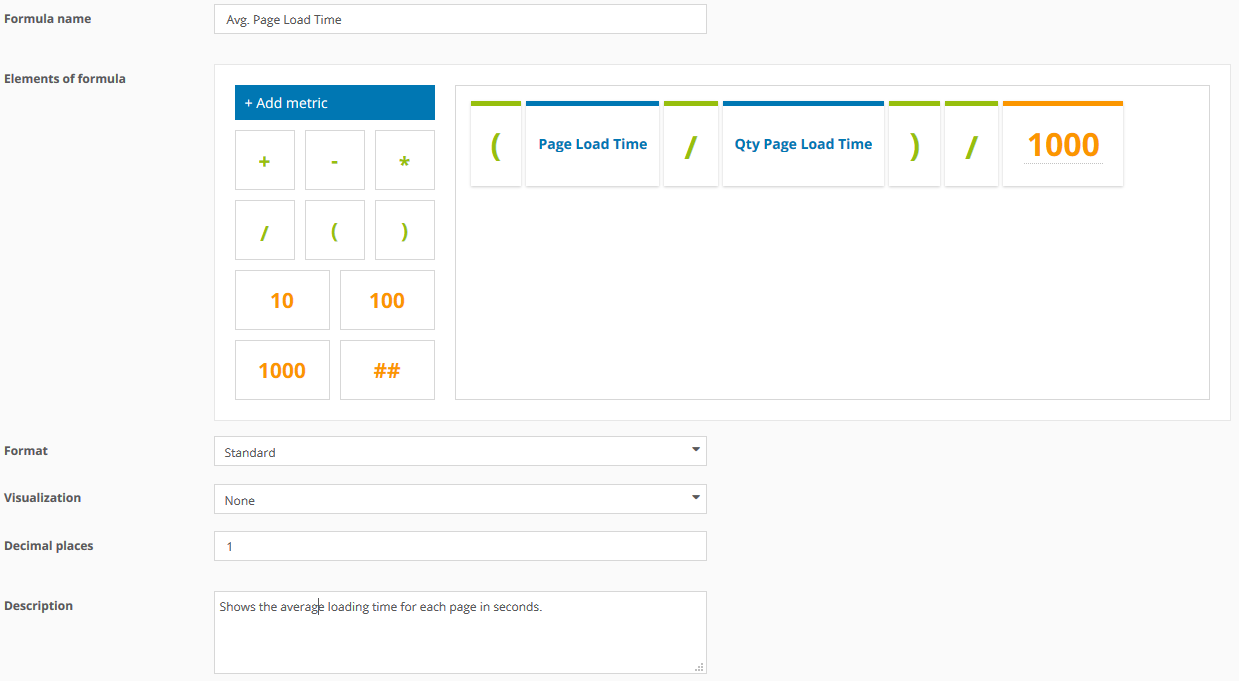
Avg. Page Load Time
The calculation of the formula "Avg. Page Load Time" shows, how long the average loading time in seconds for each page was.
Calculation:
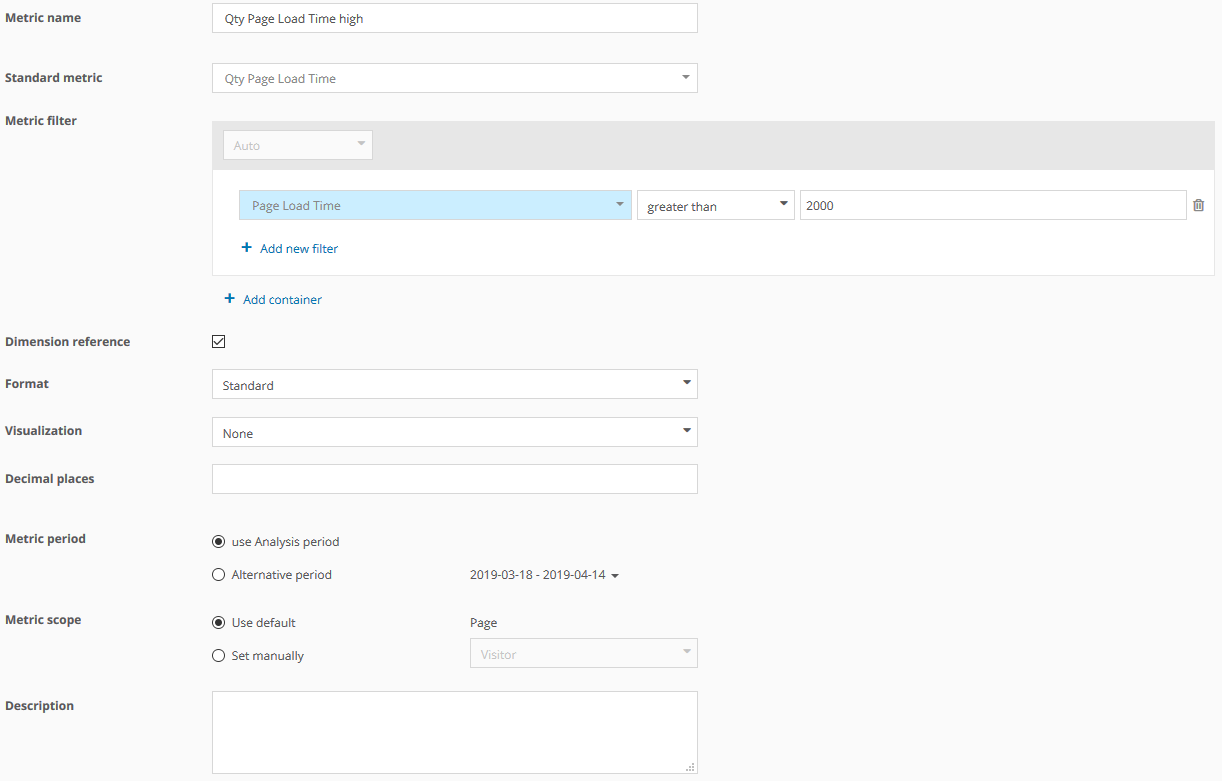
Qty Page Load Time high
This calculation is done for clustering all conspicuous load times. In the example we use a threshold value of 2 seconds.
Shows, in how many page accesses the loading time was more than 2 seconds.
Calculation:
Qty Page Load Time high %
This calculation is done for clustering all conspicuous load times. In the example we use a threshold value of 2 seconds.
Shows, in what percentage of all page accesses the loading time was more than 2 seconds.
Calculation:

As the first element in the formulas we use the just created metric "Qty Page Load Time high".
Step 4: Analysis
Which landing pages have high page load times?
The dimension "Entry Page" shows all tracked landing pages. Here we can use the just created custom figures.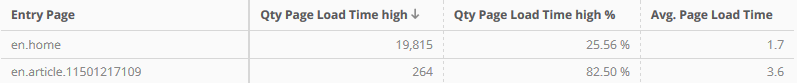
The example shows, that on the page "en.home" in 19,815 cases a page load time of more than 2 seconds was measured. This equals 25.56 % of all Page Impressions, for which a page load time was tracked. The average page load time of this page amounts to 1.7 seconds.
Please note: For all pages, for which the page load time tracking was not activated, the average page load time is depicted as "0".
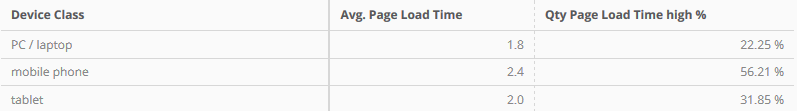
How do the page load times differ by device class?
In many cases, the page load times vary depending on the used device class.
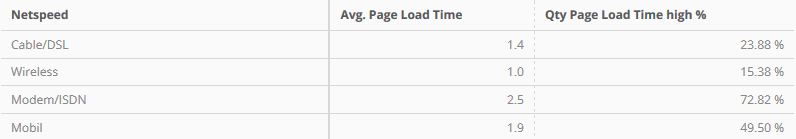
How do the page load times differ by connection speed?
The connection speed can also have a significant influence on the loading time of a page.