Content Engagement: What percentage of an article has been read?
This article shows you how you can track and analyze which share of a content element (e.g., an article) was read.
General Remarks
With Content Engagement, the usage of content elements can be analyzed in detail. It's an evolution of the pure scroll depth measurement which is also available in Mapp Intelligence. It differs from scroll depth measurement in the following points:
- You do not only measure pages, but arbitrary content. For example, an article can be divided into different elements.
- The engagement does not only consider scrolling behavior, but also the time span of how long a specific part was in the visible area of the browser window. This time span can be adapted for different browser resolutions, because on small screens usually less text is shown than on large screens.
- Besides when leaving the page, there are further options when data is to be submitted. This can assure higher data quality.
The Plugin is available in Tag Integration. Alternatively, it can be integrated as a separate JavaScript file in the standard pixel.
Please note: Content Engagement measurement does not work for Apps, nor for pages with subsequently loading content (Infinite Scroll).
Step 1: Creating the Parameter
First, you have to define Event Parameters in Mapp Q3. There, the information is stored.
| Parameter | Description | Type |
|---|---|---|
| Content Engagement - Name | Contains the name of the content element | preconfigured |
| Content Engagement - Element visibility % (figure) | Shows which share of an element was shown in the browser (e.g., 25%, 50%, 75%). Allows for using content engagement as a metric. | preconfigured (ID 922) |
| Content Engagement - Element visibility % (text) | Shows which share of an element that was shown in the browser (e.g., 25%, 50%, 75%). | preconfigured (ID 923) |
Example: Parameter "Content Engagement - Name"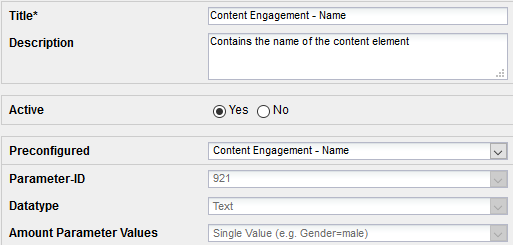
Step 2: Activation in Tag Integration
This Best Practice shows the integration of Content Engagement when using Tag Integration. For additional technical information, please have a look at the Development section. Integrate the Plugin "Content Engagement" into the Container where the website that should be measured is located.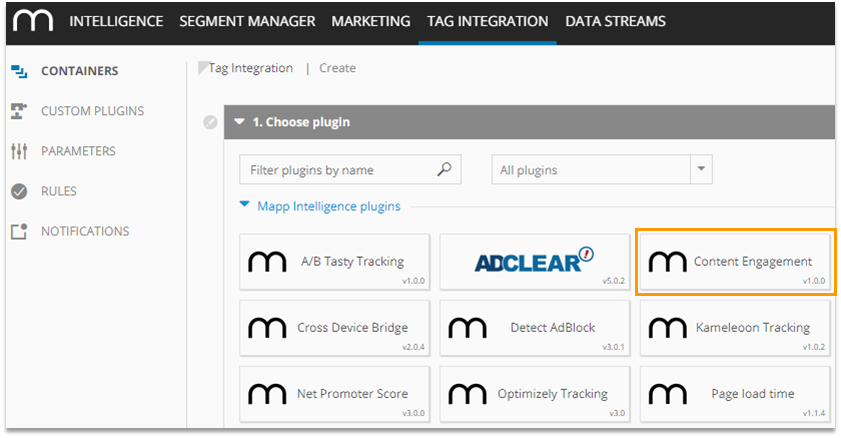
The Plugin settings can be changed in the Plugin configuration.
Request Configuration
In the request configuration 2 different settings can be defined:
- In which steps regarding the percentage should the engagement be analyzed?
The predefined setting is 5 percent. - When should the information on engagement be sent?
3 options are available:- on leaving the page (preconfigured)
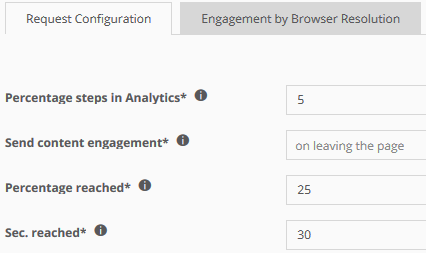
Please note that the engagement information is possibly not passed if the user closes his browser. - after reaching % of content
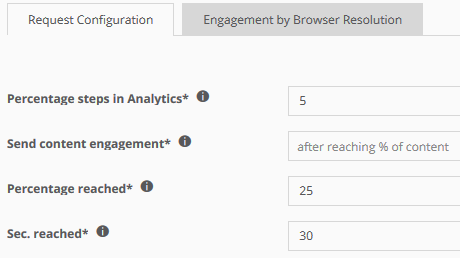
The information is sent as soon as the defined engagement value was reached ("Percentage reached") Steps of 25% are predefined, i.e., if an article has been viewed completely, the information is passed 5 times (0%, 25%, 50%, 75%, and 100%).
Advantage of this method:- It is less likely that values are missing because a user closed his browser, as data is passed gradually. The smaller the chosen value, the higher the accuracy.
- Allows a funnel-like analysis: After which share (stepwise) do users stop viewing?
- after reaching x seconds if % steps changed
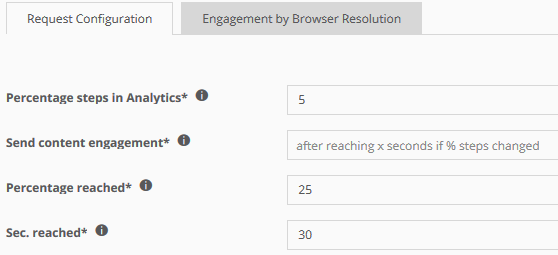
The information is sent as soon as the defined time is reached. Also, it is sent after closing the browser if engagement increased. 30 seconds are predefined.
If an article has been viewed for 90 seconds and the engagement at 30 seconds is 10%, at 60 seconds is 10% and at 90 seconds is 20%, the information is passed two times (after seconds 30 and 90).
Advantage of this method:- It is less likely that values are missing because a user closed his browser, as data is passed gradually. The lower the chosen time, the higher the accuracy.
- on leaving the page (preconfigured)
Definition of Engagement
For calculating the engagement, the content is split into equal-sized parts. Each part has to be shown for a certain amount of seconds in the browser to count as engagement. Many websites dynamically adapt to the size of the browser window. High resolutions usually show more text than low resolutions. Consequently, the user needs more time to read the content for high resolutions.
Here, the time in seconds that is necessary to count as "engagement" can be defined for three groups of browser resolution (small, medium, large).
Hint: In the debug mode (see Step 4) you can check the settings directly on your website.
At "Assign rules" you define on which page areas the engagement should be measured.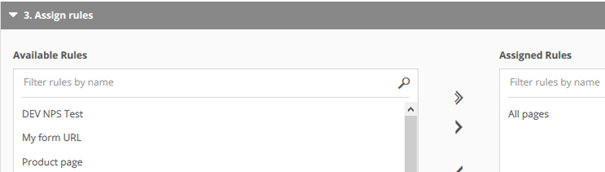
Add the plugin and publish the container.
Step 3: Integration into the website
The elements for which engagement should be measured have to be flagged in the website code.
Example 1: Measuring the complete page
To measure the complete page, add the following code.
window.wt_rt = window.wt_rt || [];
window.wt_rt.push(
{
selector: 'body'
}
);In this case, the page name (ContentId) will be the name of the element.
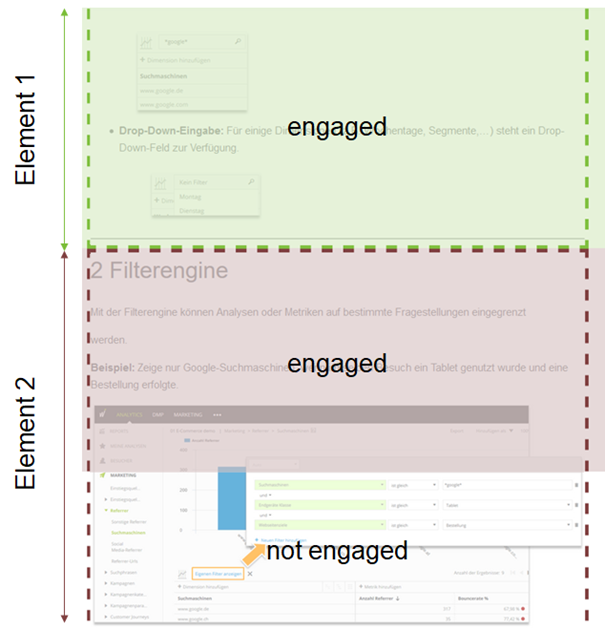
Example 2: Measuring more than one element on a page.
If more than one element is on your page, each element must be flagged and named individually.
Add the following code:
window.wt_rt.push(
{
selector: '#content-engagement-1',
name: 'Element1'
}
);

window.wt_rt.push(
{
selector: '#content-engagement-2',
name: 'Element2'
}
);- "selector" contains the attribute that has to be assigned to elements in order to be measured.
- "name" contains the name that is shown in the analysis.
In the html-Code the integration could look as follows:
<div id="content-engagement-1">
...
</div>

<div id="content-engagement-2">
...
</div>Step 4: Checking the Configuration
In the Debug mode, the configuration can be checked directly on the website.
- Are all elements flagged correctly?
- Did I choose proper time intervals for counting engagement?
To this end, open the corresponding page and add the URL parameter "wt_debug=1".
Example: http://new.domain.com/start.html?wt_debug=1
Step 5: Creating Custom Formula
A custom formula will help you when analyzing engagement later. The configuration of the formula depends on the chosen request configuration
Content Engagement at least 50 %
Shows how often at least 50 percent content engagement were measured.
Configuration "after reaching % of content"
Calculation: 
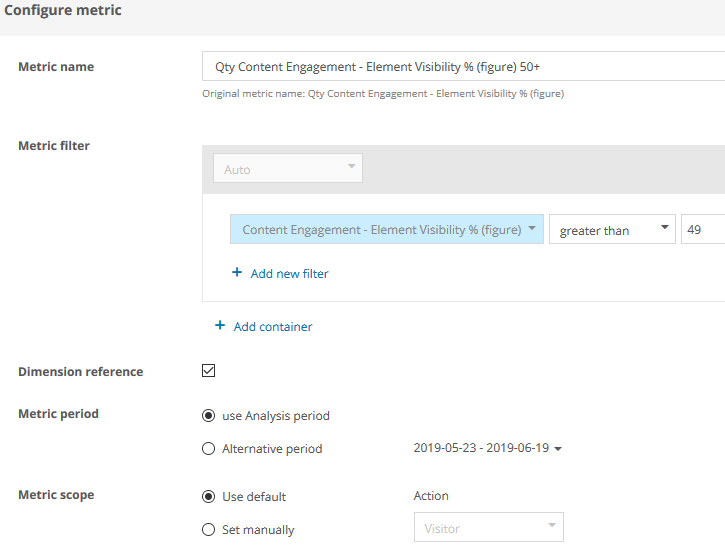
- The first element of the formula is filtered as follows:
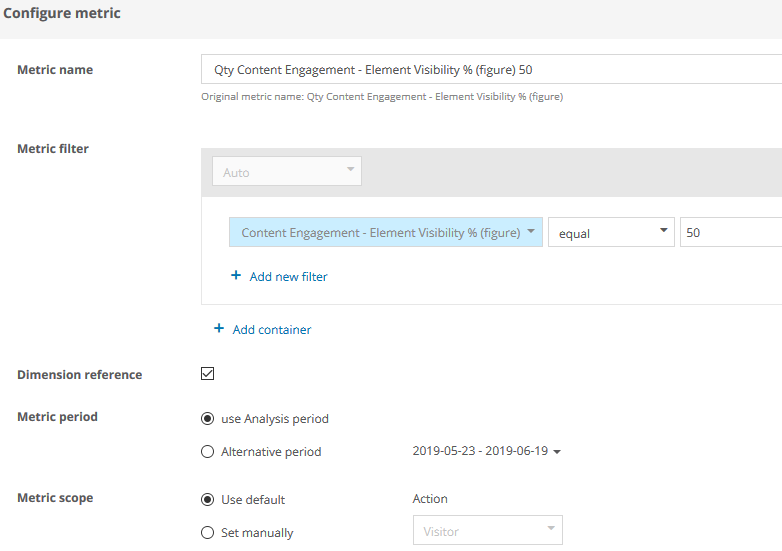
- The second element of the formula is filtered as follows:
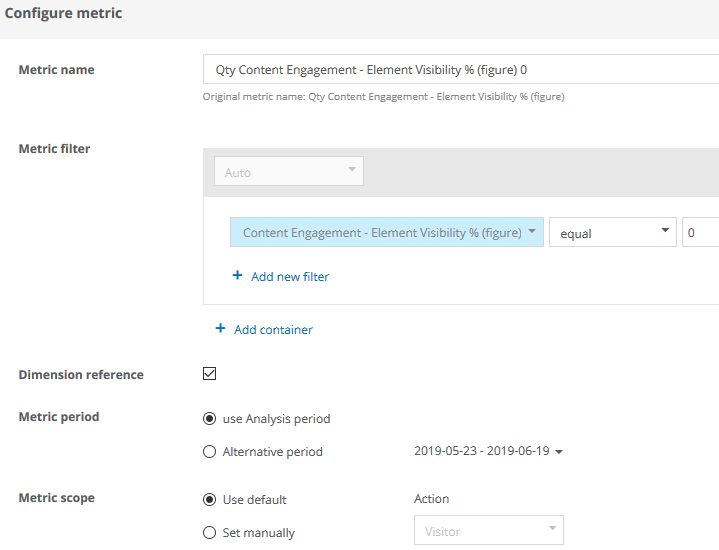
Configuration "on leaving the page"
Calculation: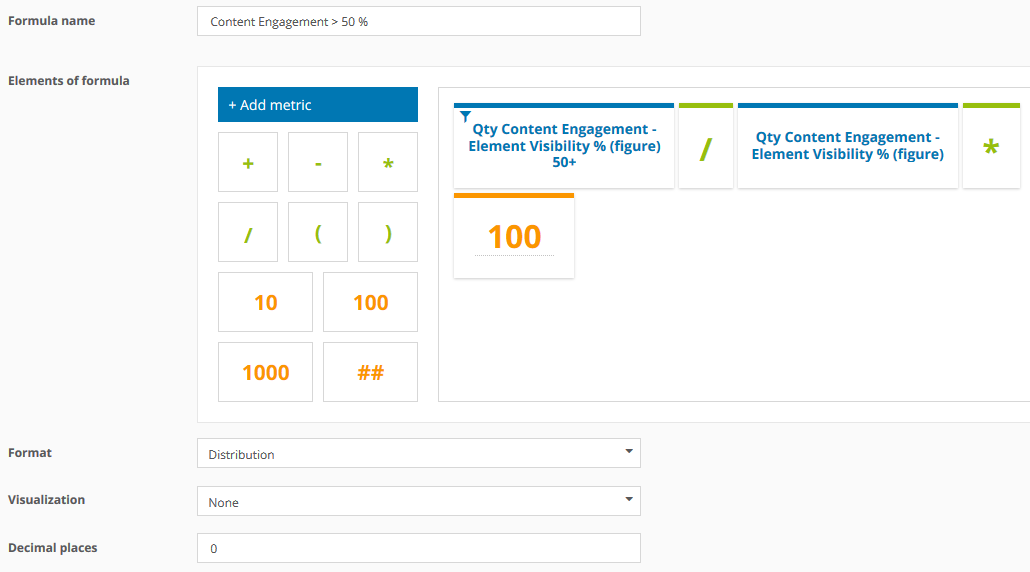
- The first element of the formula is filtered as follows:
Step 6: Analysis
In which share of views have at least 50 percent of an element been engaged?
Path: Navigation > Event Parameters > Content Engagement - Name
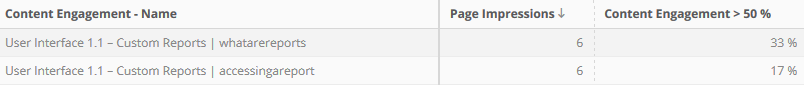
- Page Impressions: Shows how often an element has been shown.
Please note: If a visit was ended (session timeout 30 minutes) and content engagement was measured only afterward, no page impression is counted.
If you use the request configuration "on leaving the page" you should alternatively use the metric "Qty Content Engagement - Name". - Content Engagement > 50 %: Shows the number of views where an element has been engaged for at least 50%.
What's the distribution of the engagement for each element?
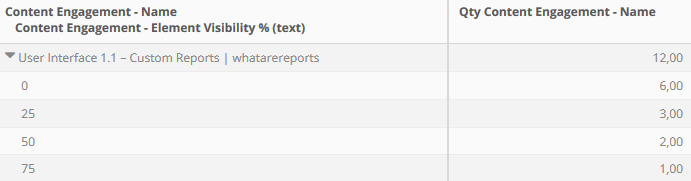
Reading example:
- 12 times any content engagement has been measured.
- 6 times 0% content engagement has been measured.