Statistics help you to evaluate the performance of your whiteboard and improve it with real-time feedback about the behavior of contacts.
It reflects the number of contacts who complete a particular step in the whiteboard or reached the whiteboard goal.
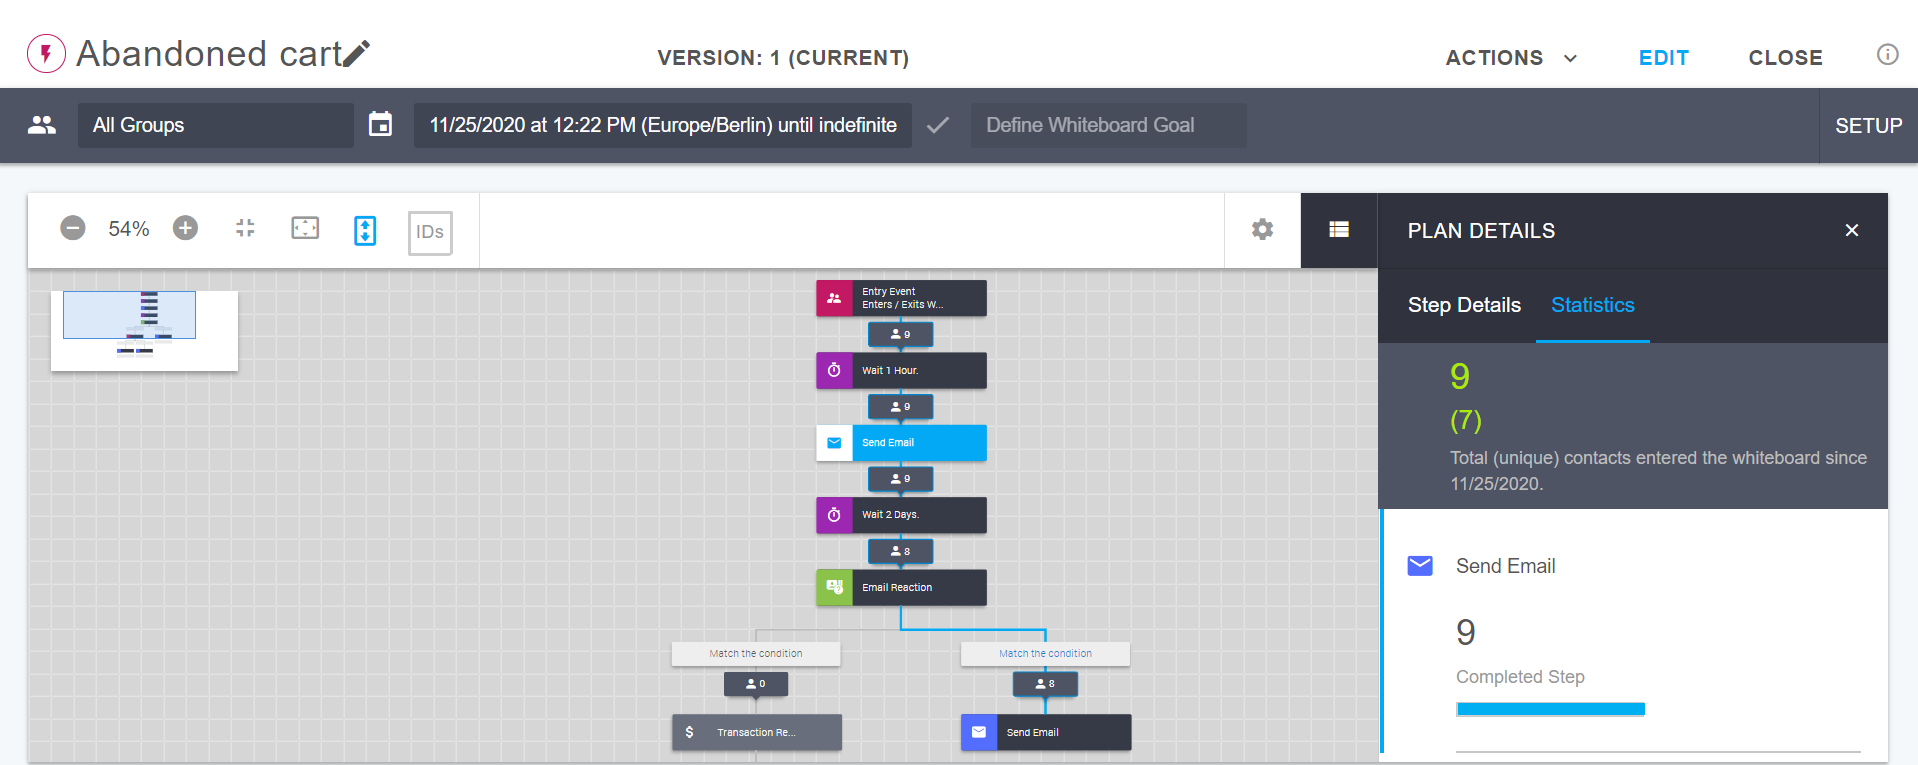
Statistics appear in the Plan Details of event-based or recurring whiteboards with the status "Active", "Phasing Out", or "Ended" in the Statistics tab.
Advantages
Analyze your whiteboard and improve it over time.
Use statistics with Segments and random split as an A/B test tool. This tool can be used for entire campaigns or parts of campaigns before the final launch.
Watch the following video for detailed information.
Step Statistics
Use the step statistics to assess the success of your whiteboard based on the number of contacts who follow a certain path. Each step shows the number of contacts who successfully exit the step and continue to the next step.
Statistics help you evaluate and potentially correct the possible reasons that contacts leave a whiteboard. If contacts drop out of the whiteboard journey, the next steps will show fewer contacts. There can be several reasons for a contact to leave the whiteboard:
The contact leaves the audience group. This action can be an unsubscribe or a removal from the group.
The contact is deleted or anonymized in the scope of GDPR requirements.
The contact does not meet the filter criteria. This condition can happen even if the negative path is not active.
The contact fulfills the whiteboard goal.
Goal Statistics
You can view the number of contacts who meet the goal for a specific whiteboard. This goal is assigned to the last marketing action, for example, an email, SMS, or push notification.