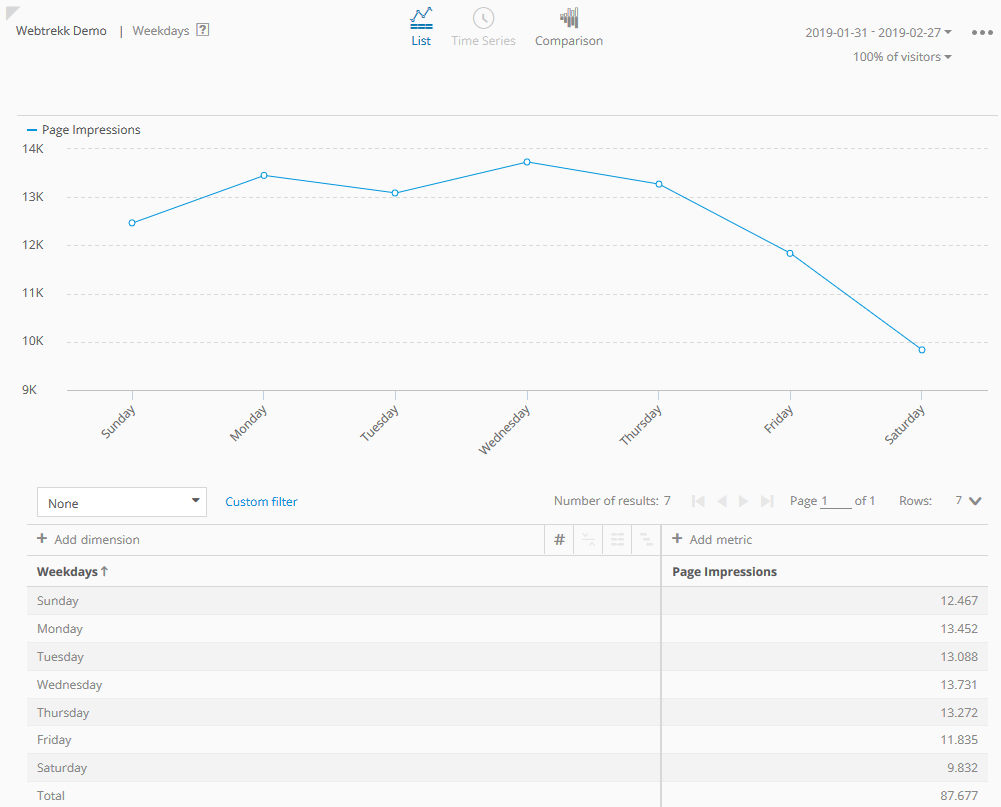
The "Weekdays" analysis shows the Page Impressions per weekday.
The following dimensions and metrics are shown in this analysis (click on the link for more information):
Add the dimension "Hours" to analyze more precisely when the website was accessed on each weekday. This way, you can, for example, determine at which times you should execute certain marketing campaigns.
List view
In the "list" view, the analysis is sorted for weekdays by default.
Reading example
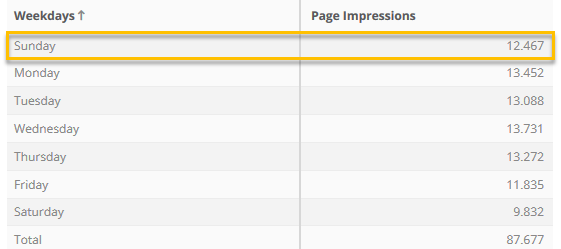
- Page Impressions: 12.467 Page Impressions were performed on Tuesdays.
Hint: If the analysis period is longer than one week, the Page Impressions of all Tuesdays would be cumulated.
For the metric "Visitors", the calculation is done uniquely per weekday. Example: A user always visits your website on Mondays. He is counted as 1 visitor, even if you choose more than one week as analysis period.
Comparison view
In the "Comparison" view, you can compare time periods as well as segments.
Reading example for comparison of time periods
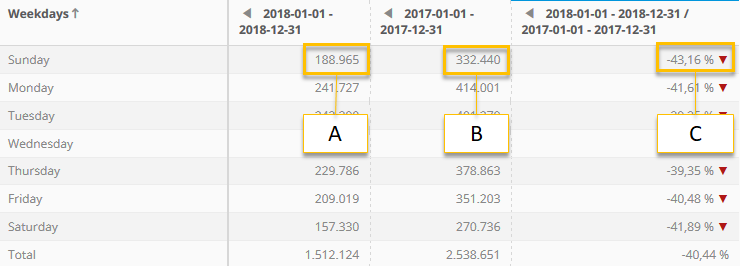
- A: 188.965 Page Impressions were performed on all Sundays in 2018.
- B: 332.440 Page Impressions were performed on all Sundays in 2017.
- C: In 2018 there 43,16 % less Page Impressions than in 2017.