Analytics don't usually provide context when an anomaly occurs. The busywork of a web analyst is to regularly look into the analytics tools or read reports and discover the issue. Then the great search begins: what caused the anomaly? Did anyone do anything? Was a campaign launched or stopped? Is the website still working across all browsers, devices, and countries? Our revenue monitoring service now provides a lot of help to figure things out quickly.
Key Benefits
Automated notification in case of an anomaly for revenue (metric: Order Value) via email and in the Mapp Intelligence notification feed.
Data can be checked daily or hourly.
Integrated root cause analysis to identify reasons for the change.
How does it work?
Root cause analysis is deduced in two ways:
Tracing the origin of the anomaly in a causal graph. Example: lower average order value led to less revenue.
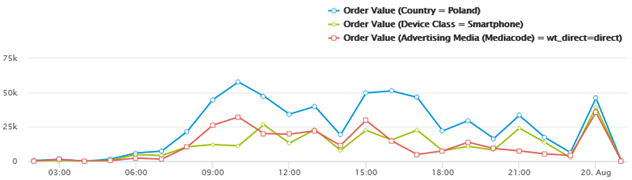
Showing the 3 dimensional values most correlated with the drop or increase. Example: revenue dropped from the country Poland, via Smartphone and via Direct campaign.
Availability
This optional feature is part of our Fall Update 2022 which went live on November 8th. It is available for all users of our Predictions Package. To get it activated for your account, contact your Customer Success or Account Manager.