Mapp Cloud Debugger
Mapp Cloud Debugger is a Browser Extension that allows you to see all outgoing Mapp Intelligence Tracking Requests from your Website. It currently supports Google Chrome, Microsoft Edge, and Mozilla Firefox.
You can also find a course with use cases for the Mapp Cloud Debugger in Mapp Academy. Log in and search for "Mapp Intelligence - Reviewing Browser-based Tracking Data".
How Can I Install the Extension?
Google Chrome
You can install the extension from the Google Chrome store. Search for Mapp Cloud Debugger in the Chrome Webstore or click the following link.
Mozilla Firefox
You can install the Add-On from the Firefox Add-ons page. Search for Mapp Cloud Debugger or click the following link.
Microsoft Edge
You can install the Add-On from the Edge Add-ons page. Search for Mapp Cloud Debugger or click the following link.
Getting Started
This video shows how to activate the Debugger (in Google Chrome) and enable tracking request recording.
The following shows you some basic usage, including filtering on request types and parameters
Advanced Options
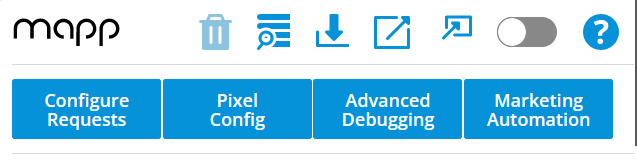
Configure Requests
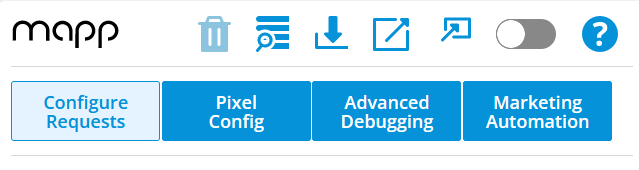
This tab lets you adapt the shown requests based on your needs:
- Which request types should be shown?
- Which information should be visible?
Pixel Config
This allows you to check and compare several pixel instances.
How to check and compare pixel instances from all open browser tabs:
- Open the Debugger in tab mode.
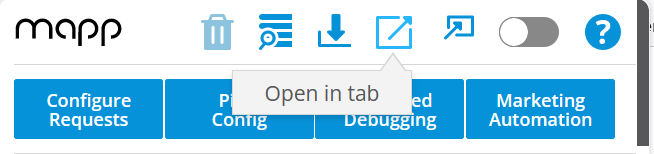
- Click Pixel Config
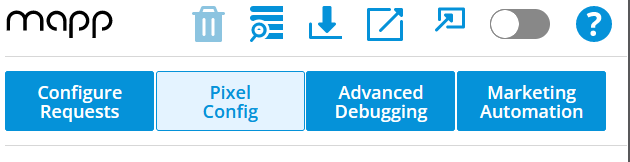
You'll get the pixel instances from all tabs that are opened in your browser, as well as an additional row that shows missing headers and a link to generate them.
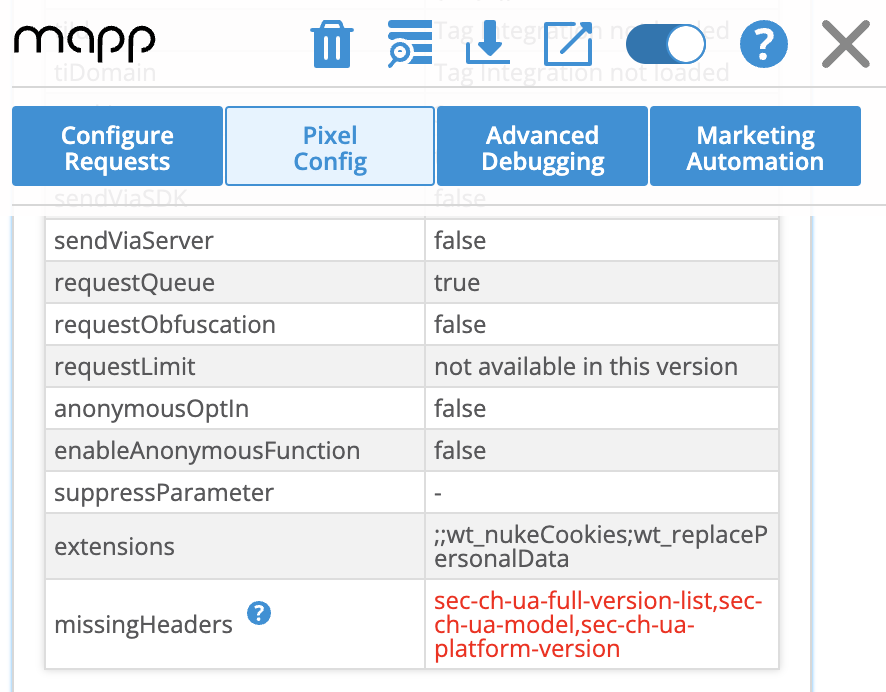

You will find a description of each attribute in the technical documentation of the used pixel version.
Advanced Debugging
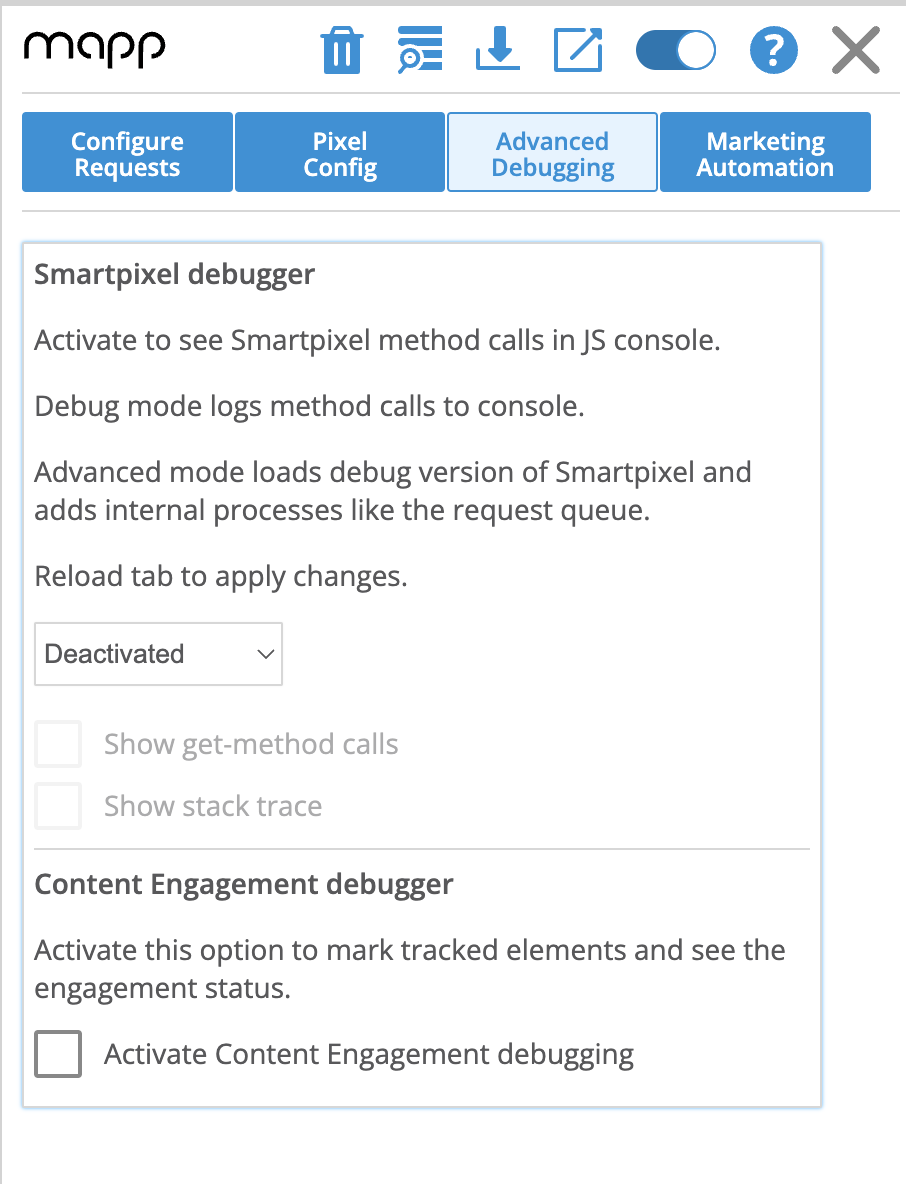
Advanced Debugging allows you to debug all your smart pixel-based tracking variants. It shows who is calling which function and in what order.
To activate the Smart Pixel debugger, choose "Debug" or "Advanced Debug" from the dropdown menu.
- Debug shows function calls
- Advanced Debug shows function calls and additional internal information (internal errors, incorrect configuration, etc.)
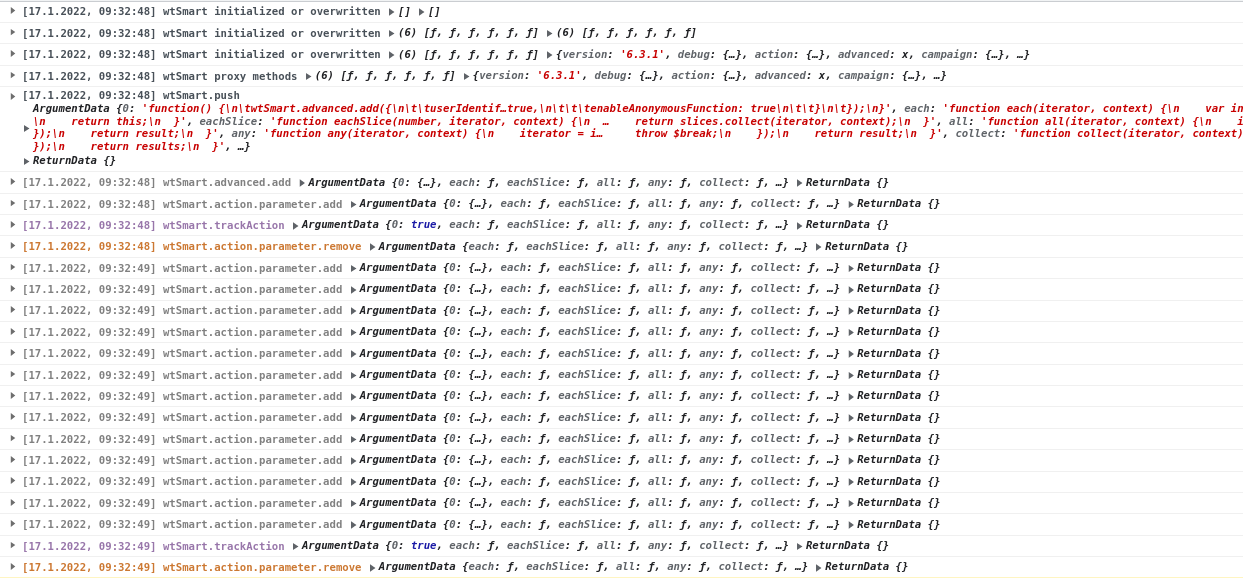
You can then use the developer tools in your browser for debugging.
You can also choose to enable the Content Engagement debugger on this tab. Please see the Debug section of Content Engagement for more information. Please note that after enabling the feature, you will need to reload the page to see the markings. With this set up you will not need the developer's console as described above. You can also find more information on this here.
Marketing Automation
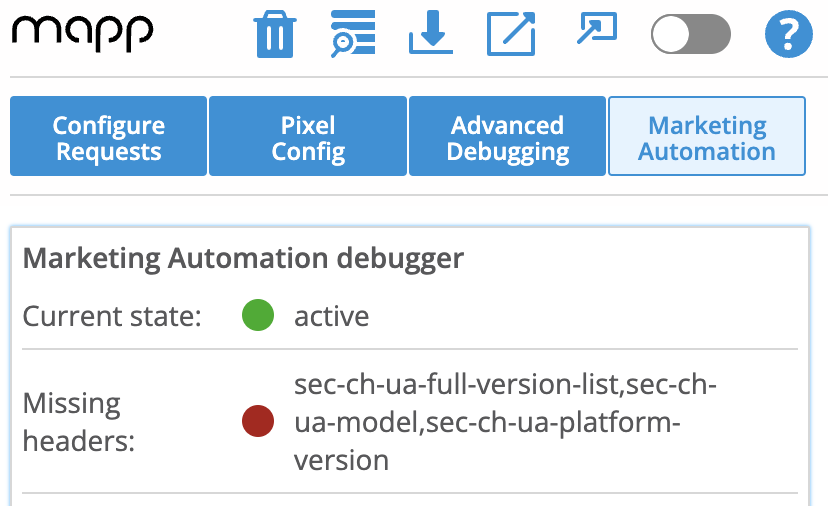
In this section, you can analyze and trigger Marketing Automation campaigns.
- Is Mapp Marketing Automation activated?
- Are there any missing headers? And if so, which?
- Which Account (Track-ID) is used?
- Which Ever-ID is currently used? You can also change it.
- Are you considered a new user?
- Which Marketing Automation campaigns are running?
- You can retrigger campaigns (Layer and Audience Streams, only)
Requests Table
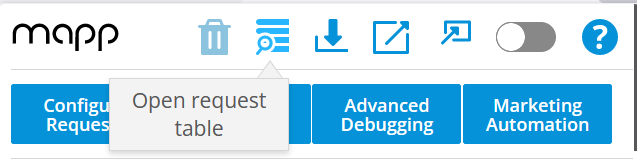
The Request Table allows you to analyze parameter data in a table in real time. The data is synced to the Request configuration settings of the plugin, and new requests will appear on top of the table.
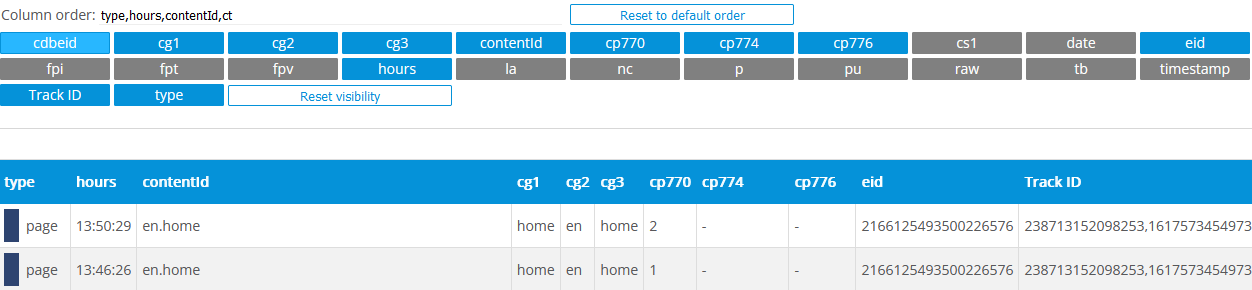
- Change order
At the top, you can define the order in which the parameters shall appear in the table. Use commas to separate parameter names. - Visibility
You can select the parameters that are added to the table by clicking on the corresponding parameter name above the table. - Download
Below the table, you can download the table in a CSV file.
A maximum of 200 Requests are supported. If you have more requests, the oldest ones get deleted.
Download
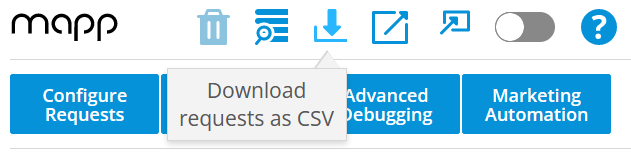
Click the download icon to download all requests in a CSV file. Requests that are filtered out via the Configure Requests dialog will not be exported.
Related
Whats going on with User Agent Client Hints?