How to easily migrate from Mapp Q3 to Mapp Intelligence
This article shows which steps to take when you want to migrate from Mapp Q3 to Mapp Intelligence.
1. Migrating users from Q3
There is a migration tool that allows to take over existing logins from Q3 to Intelligence.
We recommend creating the following things first in Mapp Intelligence:
- User Roles: Which rights (e.g., regarding accounts and analyses) does a user have?
- Categories: Which reports should be accessible for which user groups?
Further information on creating user roles and categories can be found in the Support Center in the best practices User Management: Basic Use Case und User Management: Extended Use Case.
In Mapp Intelligence, click on [Login Name] > User Management > Import Users to migrate single users from Q3.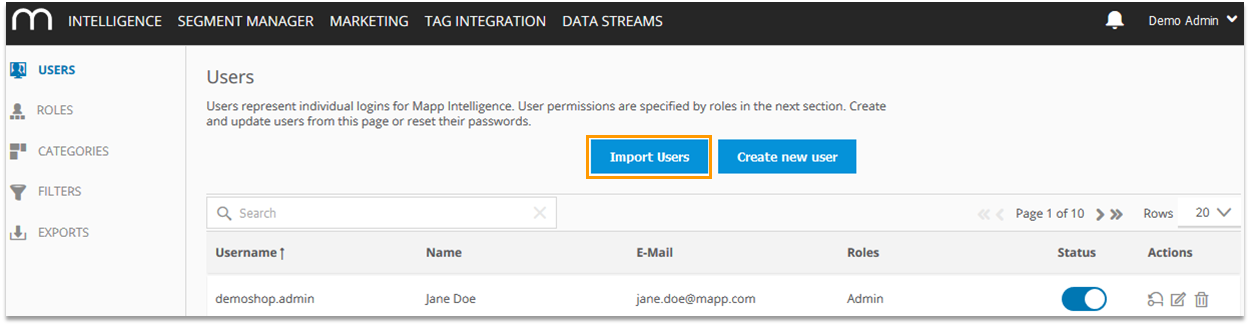
The following things will be taken over from the Q3 configuration:
- Username
- Name
Please assign to each user his first name, password validity, and a role that has been assigned to him in Mapp Intelligence to complete the import.
Each newly created user will receive a welcome e-mail containing the login information.
Please note that the login for Mapp Intelligence can only be used on suite.webtrekk.com and not on the Q3 login page.
If the option "Import users" is not available, please contact us.
2. Migrating reports
There is a migration tool that allows you to take over existing reports from Q3 to Intelligence.
In Mapp Intelligence, click on Reports > Overview > Import Q3 Report.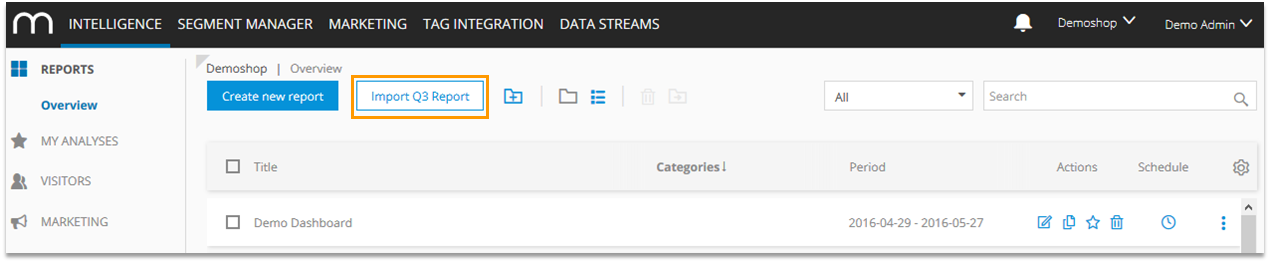
Choose the report that you want to import. Please assign the report to at least one category because otherwise only administrators can see the report.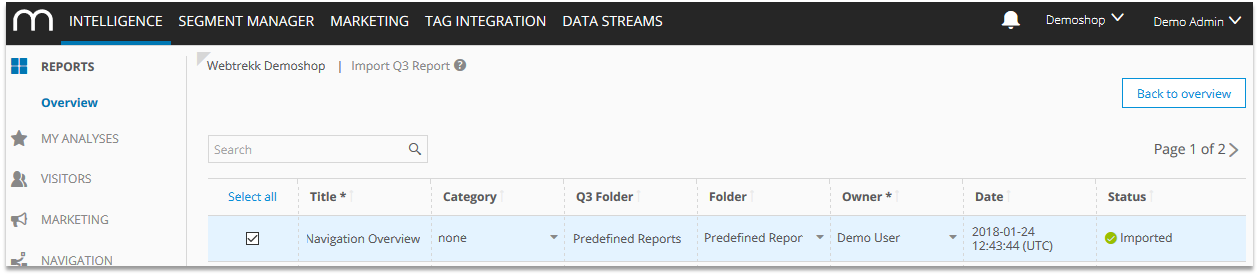
Further information on reports can be found in the Support Center in the training chapter on Custom Reports.
If the option "Import Q3 Report" is not available, please contact us.
Further remarks:
- Data collection and configuration (e.g., custom parameters, categories, custom figures) don't have to be adapted. Here, Mapp Intelligence uses the setup of Q3.
- User management configurations done in Q3 are only to a certain extent compatible with those of Mapp Intelligence. User Configuration in Mapp Intelligence is significantly easier than in Q3.
- Reports created in Q3 are only to a certain extent compatible with those of Mapp Intelligence because the functionality has been extended.
Among the things that are not taken over are:- Scorecards
- Metrics and formulas that do not exist in Mapp Intelligence:
- Process Conversion Rate
- Custom Formulas that contain functions
- The Time Series view in Mapp intelligence differs from Q3 in the following points:
- The "%" symbol is not shown in the analysis
- Columns without values are also shown
- Visualization of metrics is not supported
3. Discover new functions in Mapp Intelligence
When logging in for the first time, you'll probably recognize that the user interface is more comprehensible and calculation takes less time than in Q3.
- User Interface
The most remarkable changes for users that used Q3 before are the following:- You can create a pivot table out of an arbitrary analysis by adding a further dimension.
- Changes that were made to an analysis are saved for the time of the session.
- extended filter functions (containers, interest filters)
- free Support Center containing extensive information
- fast calculation mode
- drill down is also possible in a pivot table
- sorting for formulas (e.g., conversion rate)
- new analyses (Video Analytics, Page Detail, Engagement)
- Reports
The most remarkable changes for users that used Q3 before are the following:- simpler editing of analyses (WYSIWYG)
- new report elements (Single KPI, Sparkline)
- Comparison time periods considering weekdays (Sliding Window)
- simple integration of external data sources (e.g., YouTube, Slideshare, Live Screenshots ...)
- quick filtering on all analyses using report filters
- reports can be interconnected by links
- various possibilities to design a report (layout, scaling)
- pivot tables can be opened in reports
- easier user management by assigning users to report categories.
- complete PDF export
- full-screen mode
- responsive fronted - usability is independent of the browser resolution or device
- better and more extensive visualizations
- fast calculation of analyses
We also can present and teach the new functions to you in an individual workshop.
For further questions, please contact your consultant.