Analyses 1 – Analyses Overview
This training chapter gives an overview of important analyses that are available in Mapp Intelligence.
1 Visitors
The visitors area allows the analysis of time series (e.g. days, weeks), long-term user behavior and user rating, segments, depths of engagement, geography and technology.
1.1 Weekdays
What is the trend of important KPIs per weekdays?
Analysis: Visitors > Time > Weekdays 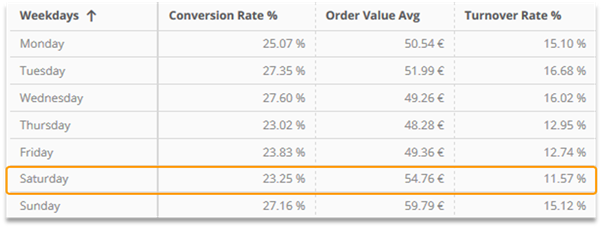
| Reading Example | |
|---|---|
| Conversion Rate % | 23.25 % is the relation between visitors and orders. |
| Order Value Avg | On Saturdays, an average order value of EUR 54.76 was generated. |
| Turnover Rate % | 11.57 % of the turnover is generated on Saturdays. |
1.2 New Visits vs. Returning Visits
How do visits divide into new and returning visits?
Analysis: Visitors > Visits > New vs. Returning 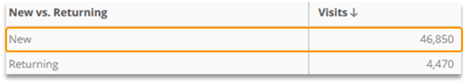
| Reading Example | |
|---|---|
| Visits | 46,850 visits were performed by users who visited the website the first time. |
1.3 Regions
From which regions did users access the website?
Analysis: Visitors > Geography > Region 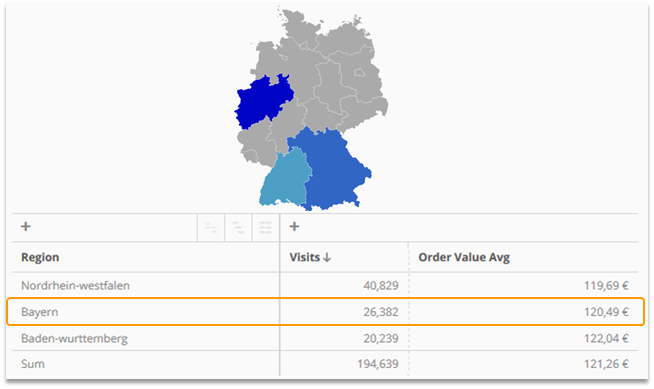
| Reading Example | |
|---|---|
| Visits | 26,382 visits were performed by users from Bayern. |
| Order Value Avg | On average, the order value of users from Bayern was 120,49 €. |
1.4 Visit Frequency
How many days elapse between visits?
Analysis: Individual Analysis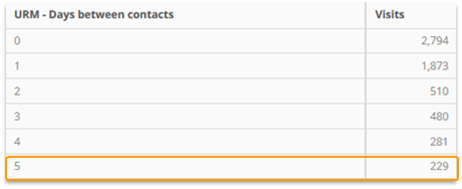
| Reading Example | |
|---|---|
| Visits | For 229 visits the last access to the website was 5 days prior to the latest access. |
More Information: Training chapter User-Centric Data
1.5 Order Frequency
How many days elapse between orders?
Analysis: Individual Analysis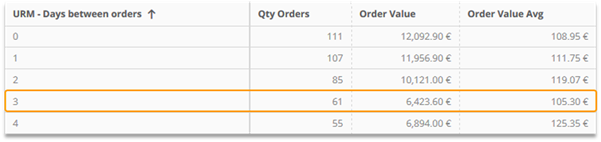
| Reading Example | |
|---|---|
| Visits | For 61 orders the last order was 3 days prior to the latest order. |
| Order Value | The order value of EUR 6,423.60 was generated with orders, in which the last order took place 3 days prior to the latest order. |
Order Value Avg | The average order value of EUR 105.30 was generated with orders, in which the last order took place 3 days prior to the latest order. |
More Information: Training chapter User-Centric Data
1.6 Cohorts: Loyalty
What is the percentage of new visitors that have returned to the website in the following months?
Analysis: Individual Analysis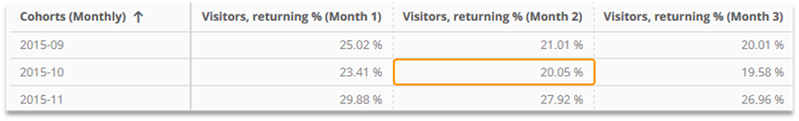
| Reading Example | |
|---|---|
Visitors, returning % (Month 2) | 20.05 % of all visitors that had their first visit in October 2015 visited the website again in month 2 after it. |
More Information: Training chapter Cohorts
1.7 Cohorts: Conversion Rate
What was the development of the conversion rate of a cohort?
Analysis: Individual Analysis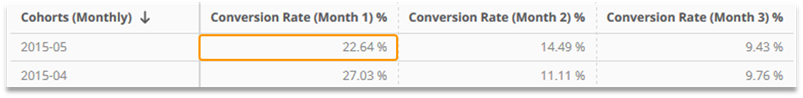
| Reading Example | |
|---|---|
Conversion Rate (Month 1) % | 22.64 % of all visitors that had their first visit in May 2015 placed an order 1 month (day 30-59) after their first visit. |
More Information: Training chapter Cohorts
1.8 Depths of Engagement
At which points do visitors abort within a visit?
Analysis: Visitors > Visits > Depths of Engagement 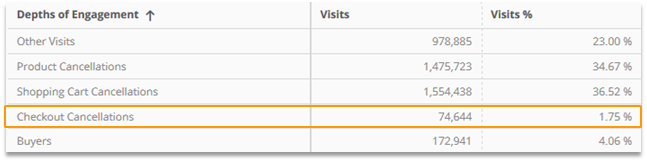
| Reading Example | |
|---|---|
Visits | In 74,644 visits, the checkout was called, but the purchase was not made. |
| Visits % | In 1.75 % of all visits, the checkout was called, but the purchase was not made. |
| Depths of Engagement can be matched individually to the goals of the website. |
|---|
More Information: Training chapter Analysis of Goal Achievement
1.9 Macro Status
Which macro status did my website visitors reach during their lifetime?
Analysis: Visitors > URM - User Relationship Management > URM – Customer Macro Status 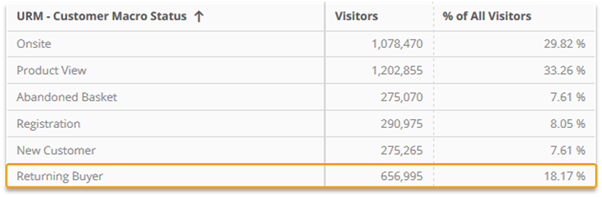
| Reading Example | |
|---|---|
Visitors | 656,995 visitors have already placed at least 2 orders. |
| Visitors % | 18.17 % of all visitors have already placed at least 2 orders. |
More Information: Training chapter Analysis of Goal Achievement
1.10 Engagement
How many users visited the website in the last 7 days, how many visited it each day?
Analysis: Visitors > Engagement 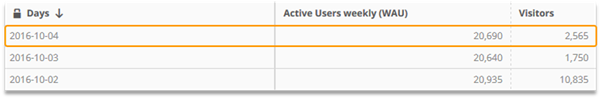
| Reading Example | |
|---|---|
Active Users weekly (WAU) | 20,690 visitors were tracked between Sep 28 and Oct 04. |
| Visitors | 2,565 users were tracked on Oct 04. |
More Information: Training chapter Basic metrics
1.11 Device Class and Devices
Which devices per device class were used for visits?
Analysis: Individual Analysis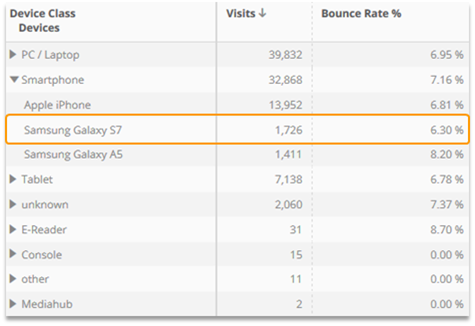
| Reading Example | |
|---|---|
Visits | For 1,726 visits a Samsung Galaxy S7 was used. |
Bounce Rate % | During 6.30 % of all visits with a Samsung Galaxy S7 only one single page was accessed. |
1.12 Browser with Device Class
Which browsers are used most frequently per device class?
Analysis: Individual Analysis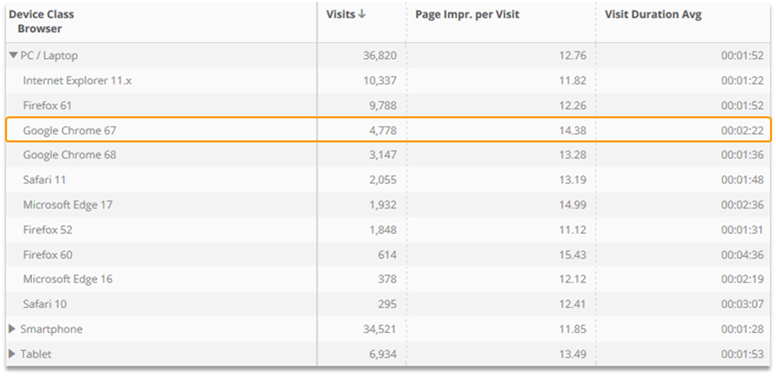
| Reading Example | |
|---|---|
Visits | 4,778 visits were done via PC/Laptop using the browser Google Chrome 67. |
Page Impr. per Visit | On average 14.38 pages were accessed during visits via PC/Laptop using the browser Google Chrome 67. |
Visit Duration Avg | On average a visit via PC/Laptop using the browser Google Chrome 67 lasted 02:22 minutes. |
1.13 Browser Resolution
What is the size of the visible area available for visitors in their browser?
Analysis: Visitors > Technology > Browser Resolution 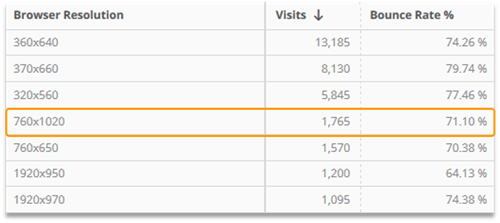
| Reading Example | |
|---|---|
Visits | 1,765 visits had a visible area of 760x1020 pixels in their browser. |
Bounce Rate % | During 71.10 % of all visits with a visible area of 760x1020 pixels in the browser only one page was accessed. |
1.14 Visits generated via TV/Radio spots
How many visits, orders and which order value was generated by TV/Radio spots?
Analysis: Individual Analysis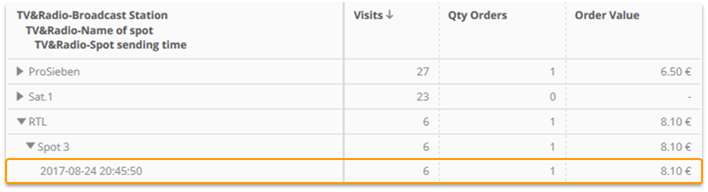
| Reading Example | |
|---|---|
Visits | 6 visits were generated by the spot with the name "Spot 3", that was broadcast on 2017-08-24 at 20:45:50 on the station "RTL". |
Qty Orders | 1 order was generated by the spot with the name "Spot 3", that was broadcast on 2017-08-24 at 20:45:50 on the station "RTL". |
Order Value | 8,10 € order was generated by the spot with the name "Spot 3", that was broadcast on 2017-08-24 at 20:45:50 on the station "RTL". |
More Information: Best ractice TV and radio tracking
2 Marketing
In the Marketing area various referrer analyses can be found.
- Referrer analyses
Automatic detection of the websites from which users accessed the website.
Advantage:
no setup necessary - Campaign analyses
Provide an individually structured referrer analysis by URL parameters, referrers, sites or actions.
requires manual setup
Advantage:
any structuring
unique mapping of website goal achievements by attribution models
2.1 Website Goals
Which website goals have been reached?
Analysis: E-Commerce > Website Goals 
| Reading Example | |
|---|---|
Conversion | 27,065 orders were measured. |
More Information: Training chapter Analysis of Goal Achievement
2.2 Referrer Analyses
Access from external websites is measured automatically.
Mapp Intelligence divides referrers into various types:
Types | Origin |
|---|---|
Search Engines | All known search engines |
Social Media Sources | All social media referrers defined in the marketing configuration (e.g. Facebook, LinkedIn) |
Other Sources | All other referrers, neither search engines nor social media sources |
Direct | No referrer existing |
More Information: Training chapter Referrer Analyses
2.2.1 Entry Sources
Where was the site entered from?
Analysis: Marketing > Entry Source Tree 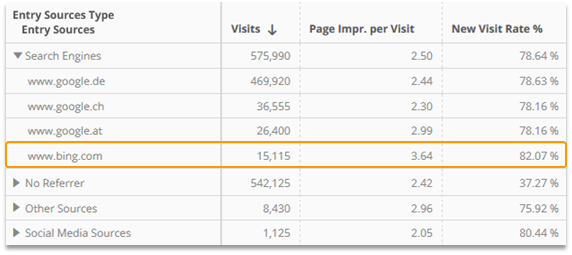
| Reading Example | |
|---|---|
Visits | For 15,115 visits the entry source was the search engine "www.bing.com". |
Page Impr. per Visit | On average 3.64 pages were accessed during visits whose entry source was the search engine "www.bing.com". |
| New Visit Rate % | 82.07 % of all visits whose entry source was the search engine "www.bing.com" were made by new visitors. |
More Information: Training chapter Referrer Analyses
2.2.2 Search Engines
Which search engines were tracked?
Analysis: Marketing > Referrer > Search Engines 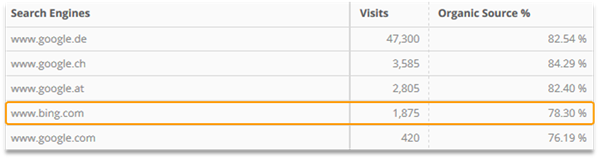
| Reading Example | |
|---|---|
| Visits | For 1,875 visits the search engine "www.bing.com" was tracked. |
Organic Source % | 78.30 % of all accesses via "www.bing.com" took place without a campaign based on a URL parameter. |
More Information: Training chapter Referrer Analyses
2.2.3 Search Phrases
Which search phrases are used in search engines?
Analysis: Marketing > Search Phrases > External Search Phrases 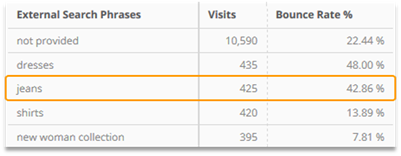
| Reading Example | |
|---|---|
| Visits | For 425 visits the search phrase jeans was entered in order to get to the website. |
Bounce Rate % | During 42.86 % of all visits with the search phrase jeans only one page was viewed. |
| For the majority of queries the search phrase could not be identified ("not provided"). This is caused by the suppression of phrases for https search requests on Google. |
|---|
More Information: Training chapter Referrer Analyses
2.3 Campaign Analyses
Campaign analyses allow detailed analyses of quantity and quality of the visits.
- All entry sources (e.g. SEO, direct entries) can be displayed.
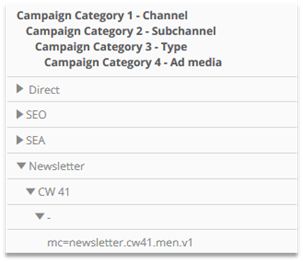
Normally, campaigns are used to reach a certain website goal (e.g. orders, contact requests).
- Within a Customer Journey, all clicked campaigns are tracked until reaching the website goal.
- Which campaign lead to the achievement of the website goal? Various attribution models (e.g. last campaign wins) are supported.
Example for a Customer Journey:
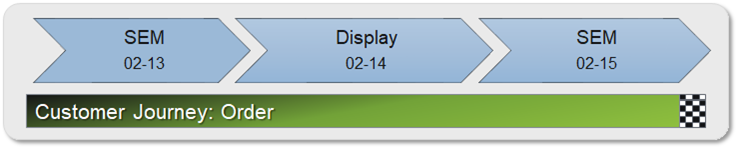
More Information: Training chapter Campaign Analyses
2.3.1 Campaign Tree
How successful are my marketing campaigns?
Analysis: Individual Analysis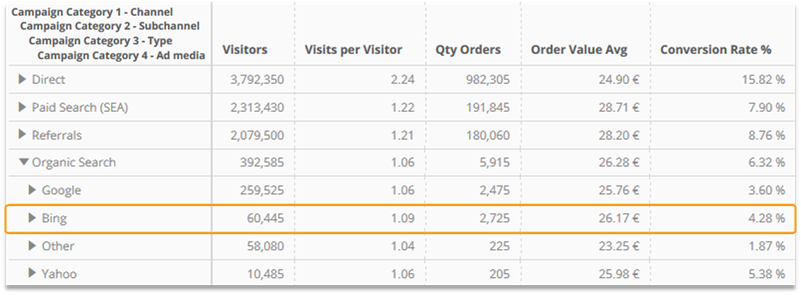
| Reading Example | |
|---|---|
| Visits | 60,445 users accessed the website via the unpaid "Bing" search. |
| Visits per Visitor | On average 1.09 visits were made by users that accessed the website via the unpaid "Bing" search. |
| Qty Orders | According to the attribution model, 2,725 orders have been assigned to the unpaid "Bing" search. |
| Order Value Avg | On average EUR 26.17 were generated per order by users that accessed the website via the unpaid "Bing" search. |
| Conversion Rate % | 4.28 % of all users that accessed the website via the unpaid "Bing" search also placed an order. |
More Information: Training chapter Campaign Analyses
2.3.2 Campaign Channels
How often have campaign channels been used in different time periods?
Analysis: Marketing > Campaign Categories > [Name of the Channel] > Comparison
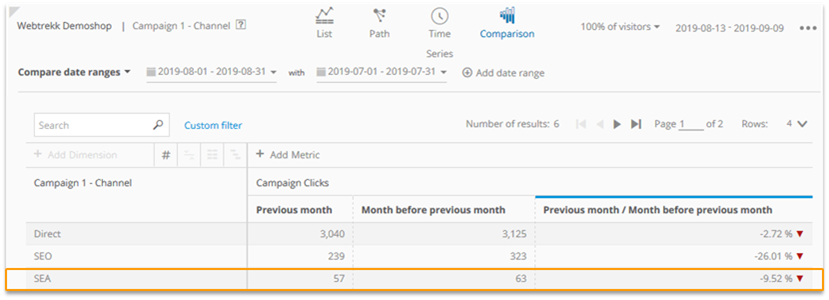
| Reading Example | |
|---|---|
| Visitors | SEM campaigns have been clicked 57 times in the previous month and 63 times in the month before the previous month. This is a decrease of 9.52 %. |
In which order are campaign channels used?
Analysis: Marketing > Campaign Categories > [Name of the Channel] > Path
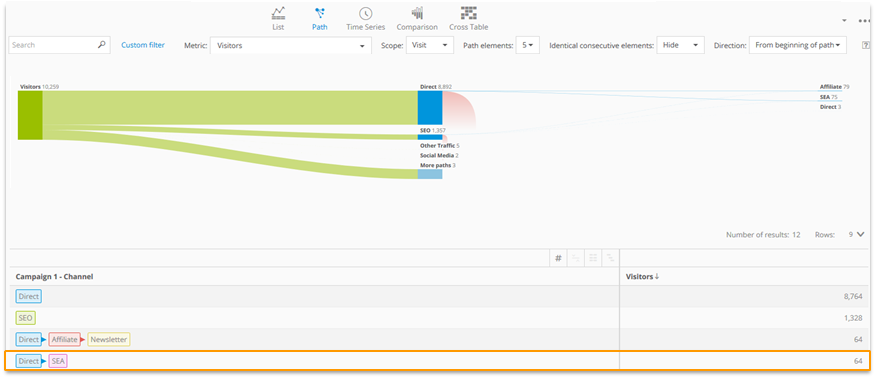
| Reading Example | |
|---|---|
| Visitors | 64 Users use within the analysis period first the channel Direct and then the channel "SEA". |
More Information: Training chapter Campaign Analyses
2.3.3 Ad Media Path
In which order have campaigns been clicked on prior to an order?
Analysis: Marketing > Customer Journeys > Ad Media Path 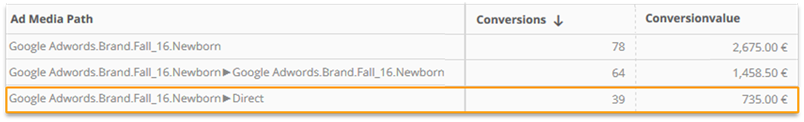
| Reading Example | |
|---|---|
Conversions | During 39 conversions the ad media "Google Adwords.Brand.Fall16.Newborn" was used first, followed by "Direct". |
Conversionvalue | A Conversionvalue of EUR 735.00 was generated, when the ad media "Google Adwords.Brand.Fall16.Newborn" was used first, followed by "Direct". |
More Information: Training chapter Campaign Analyses
2.3.4 Product Categories and Campaign Channels
Which channels in which product categories led to a purchase?
Analysis: Individual Analysis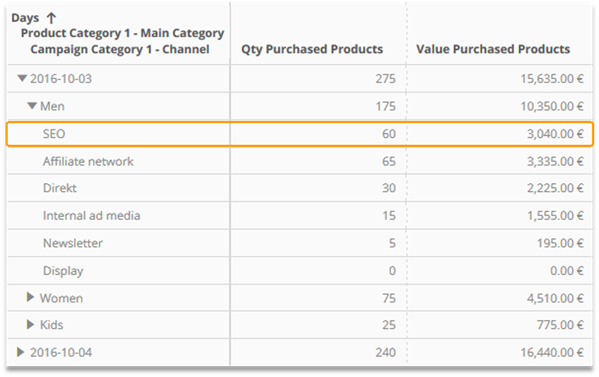
| Reading Example | |
|---|---|
| Qty Purchased Products | 60 products of the main category "Me"n were bought via the channel "SEO" on Oct 03 2016. |
| Value Purchased Products | A product turnover of EUR 3,040.00 was generated in the main category "Men" via the channel "SEO" on Oct 03 2016. |
More Information: Training chapter Campaign Analyses
3 Navigation
The following analyses provide insights about the user behavior on the website.
3.1 Pages
Which pages were visited frequently?
Analysis: Navigation > Pages > Pages 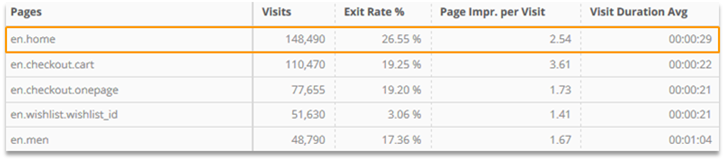
| Reading Example | |
|---|---|
| Visits | In 148,490 the page "en.home" was tracked. |
| Exit Rate % | In 26,55 % of all visits of the page "en.home" the page was an exit page. |
| Page Impr. per Visit | On average, 2.54 pages were accessed in visits were also "en.home" was accessed. |
| Visit Duration Avg | On average, a visit lasted 00:59 minutes if the page "en.home" was used. |
3.2 Entry Pages
On which pages have visits been initiated?
Analysis: Individual Analysis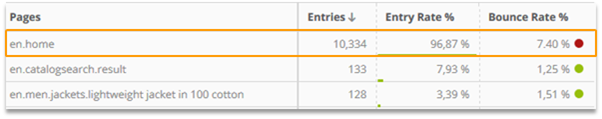
| Reading Example | |
|---|---|
| Entries | For 10,334 visits the page "en.home" was detected as entry site. |
| Entry Rate % | In 96,87% of all visits with the page "en.home", this page was also the entry page. |
| Bounce Rate % | In 7,40 % of all visits with the entry site "en.home" no further page was accessed. |
3.3 Pages Path
In which order were pages accessed?
Analysis: Navigation > Pages > Follower Pages Path 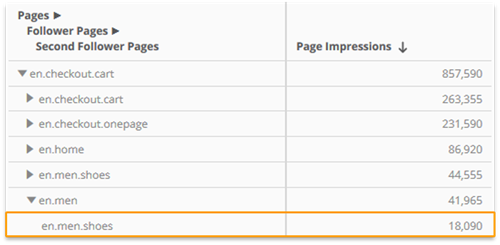
| Reading Example | |
|---|---|
Page Impressions | The pages en.checkout.cart, en.men and en.men.shoes were accessed 18,090 times directly in this order. |
| Pages Paths can also be created using the dimension „Pages“ and the analysis variant „Path“. |
|---|
More Information: Training chapter Analysis of Navigation Paths
3.4 Page Detail
Which internal and external referrers as well as follower pages and exits were there per page?
Analysis: Navigation > Pages > Page Detail 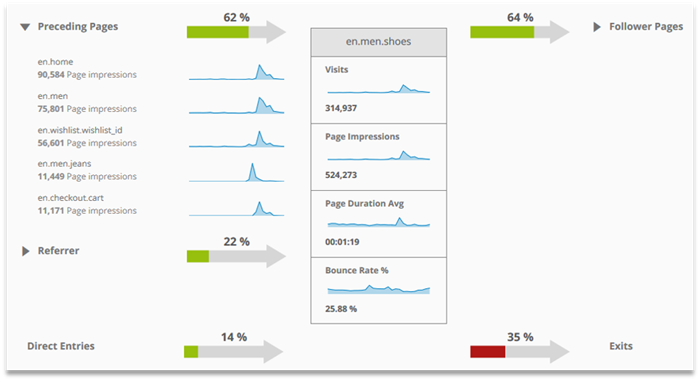
| Reading Example for the site en.men.shoes | |
|---|---|
| 62 % of all Page Impressions came from another internal site, 22 % came from other websites and 14 % entered directly | |
64 % of all Page Impressions accessed another site after it, 35 % did not. |
| Differences to 100 % in the sum are caused by rounding. |
|---|
More Information: Training chapter Analysis of Navigation Paths
3.5 Content Groups
How many visitors are using the specified areas of the website?
Analysis: Navigation > Content Groups > [Name of the Content Group] 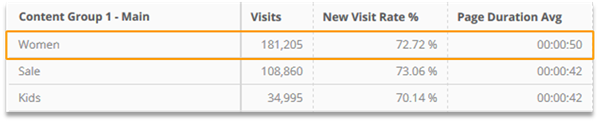
| Reading Example | |
|---|---|
| Visits | During 181,205 visits the main category "Women" was accessed. |
| New Visit Rate % | 72.72 % of all visits in the main category "Women"are made by new visitors. |
| Page Duration Avg | A single page in the main category "Women"was viewed for 50 seconds on average. |
How often have page areas been viewed in a certain order?
Analysis: Navigation > Content Groups > [Name of the Content Group] > Analysis Variant „Path“ 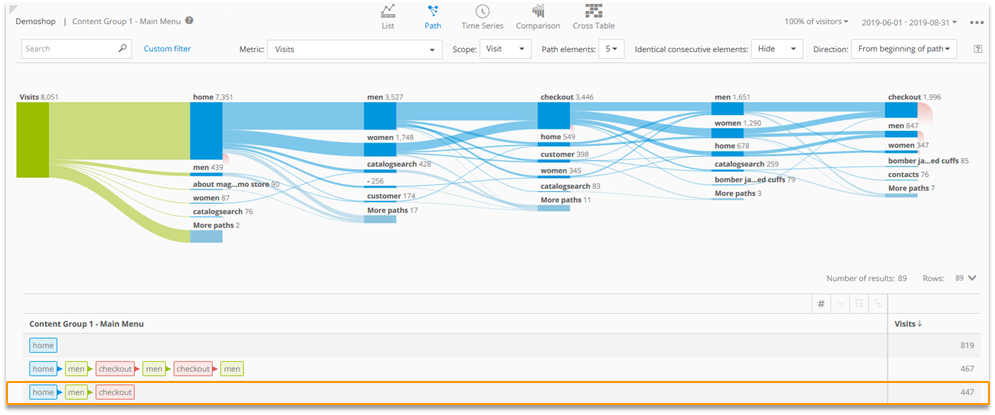
| Reading Example | |
|---|---|
| Visits | In 447 Visits the page areas "home", "men" and "checkout" have been used in this order. |
More Information: Best Practice Content Groups
3.6 Processes/Funnels
Which steps in the order/registration process have noticeable exit rates?
Analysis: Navigation > Processes 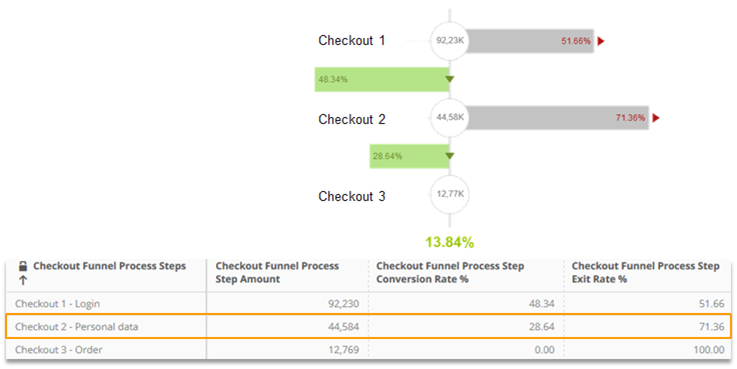
| Reading Example | |
|---|---|
| Checkout Funnel Process Step Amount | The process step "Checkout 2" has been called 44,584 times. |
| Checkout Funnel Process Step Conversion Rate % | 28.64 % out of all times in which the process step "Checkout 2" has been called it led to the following process step Checkout 3. |
| Checkout Funnel Process Step Exit Rate % | 71.36 % out of all times in which the process step "Checkout 2" has been called it led to the abortion of the process. |
More Information: Training chapter Analysis of Navigation Paths
3.7 Links and Downloads
Which links were clicked and which files were downloaded from the website?
Analysis: Navigation > Events 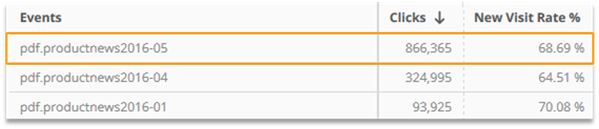
| Reading Example | |
|---|---|
| Clicks | The download link "pdf.productnews2016-05" was clicked 866,365 times. |
| New Visit Rate % | 68.69 % of all users that clicked the download link "pdf.productnews2016-05" were new visitors. |
3.8 Teaser Performance
How is the performance of teasers and teaser placements?
Analysis: Individual Analysis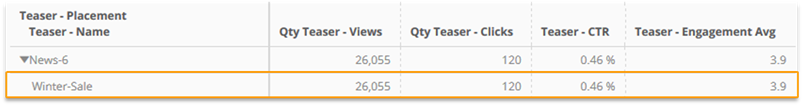
| Reading Example | |
|---|---|
| Qty Teaser - Views | The teaser "Winter-Sale" was displayed 26,055 times at the placement "News-6". |
| Qty Teaser - Clicks | The teaser "Winter-Sale" was clicked 120 times at the placement "News-6". |
| Teaser CTR | 0.46 % of all displayed teasers "Winter-Sale" were also clicked. |
| Teaser - Engagement Avg | On average 3.9 further page impressions followed after a click on the teaser "Winter-Sale". |
More Information: 3 steps to Teaser Tracking
3.9 Error Messages
Which error messages have been generated?
Analysis: Navigation > [Page Parameter|Event Parameter] > [Name of the Parameter] 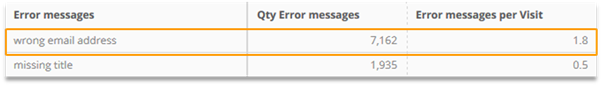
| Reading Example | |
|---|---|
| Qty Error messages | The error message "wrong email address" was detected 7,162 times. |
| Error messages per Visit* | Within a visit the error message "wrong email address" was detected 1.8 times on average. |
3.10 Internal Search
What is the performance of the internal search?
Analysis: Marketing > Search Phrases > Internal Search Phrases 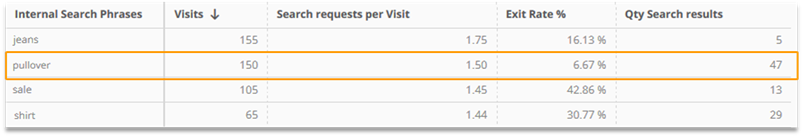
| Reading Example | |
|---|---|
| Visits | During 150 visits "pullover" was detected in the internal search. |
| Search Requests per Visit* | On average 1.5 search requests were detected in visits where "pullover" was put into the internal search. |
| Exit Rate % | 6.67 % of all visits that included an internal search for "pullover" were exited on the search result page. |
| Qty Search results* | The internal search provided 47 results for the search phrase "pullover". |
In which order were search phrases used?
Analysis: Marketing > Search Phrases > Internal Search Phrases > Analysis Variant „Path“ 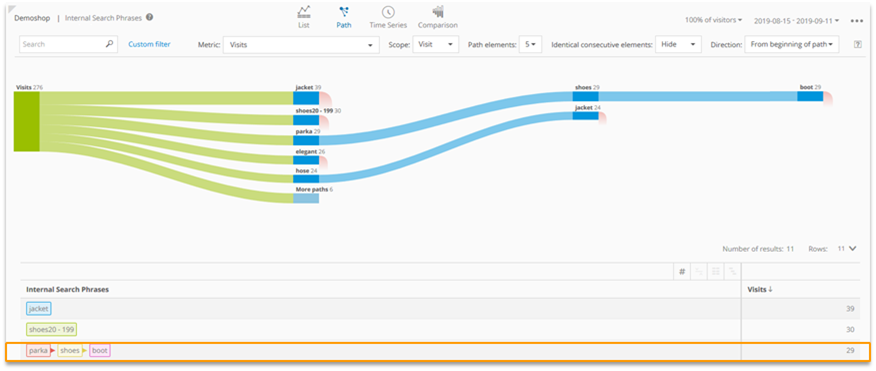
| Reading Example | |
|---|---|
| Visits | In 29 Visits, the search phrases "parka", "shoes" and "boot" were used in this order. |
More Information:
3.11 Video Analytics
How are videos being used?
Analysis: Video Analytics > Video Analytics Summary 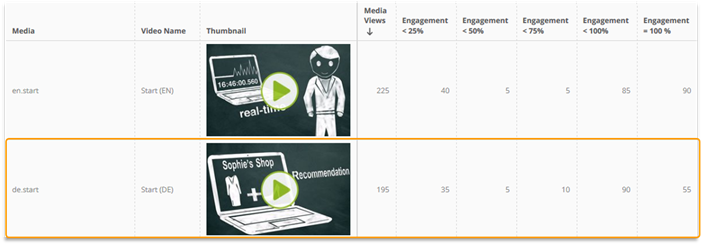
| Reading Example | |
|---|---|
| Media Views | The video "de.start" was started 195 times. |
| Engagement < 25% | The video "de.start" was viewed 35 times to an extent of less than 25 %. |
| Engagement < 50% | The video "de.start" was viewed 5 times to an extent of at least 25 % but less than 50 %. |
| Engagement < 75% | The video "de.start" was viewed 10 times to an extent of at least 50 % but less than 75 %. |
| Engagement < 100% | The video "de.start" was viewed 90 times to an extent of at least 75 % but less than 100 %. |
| Engagement = 100% | The video "de.start" was viewed completely 55 times. |
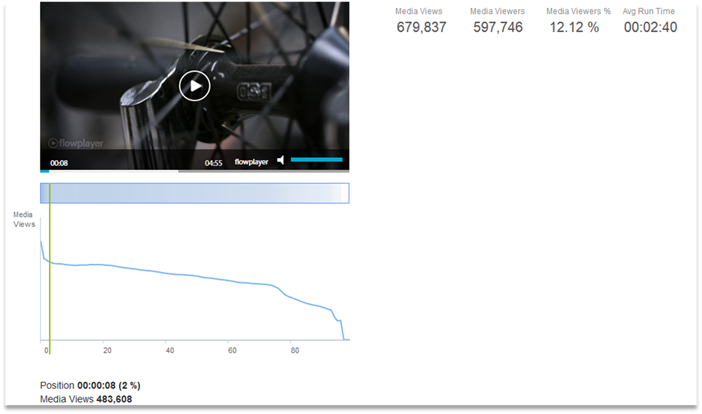
While watching a video, the current playing position is shown dynamically in the analysis. This way it is possible to follow exactly the amount of Media Views or Exits.
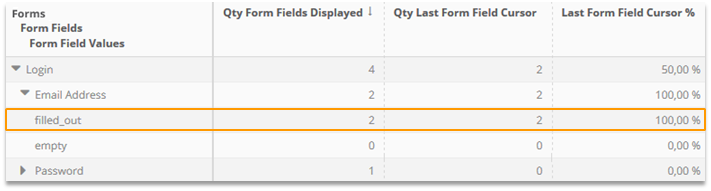
3.12 Forms
How are forms used by my visitors?
Analysis: Individual Analysis
| Reading Example | |
|---|---|
| Qty Form Fields Displayed | The form field „Email Address“ in the form „Login“ was loaded two times. It also has been filled out two times. |
| Qty Last Form Field Cursor | The form field „Email Address“ in the form „Login“ had the last focus two times before sending the form. |
| Last Form Field Cursor % | In 100% of all form field displays, the field „Email address“ had the last focus before sending the form. |
„Focus“ means here that a form field has been accessed (e.g., via clicking on it). Possibly something was entered in this field.
4 E-Commerce
Analyze orders and products.
4.1 Product Performance
What is the performance of my products?
Analysis: E-Commerce > Products 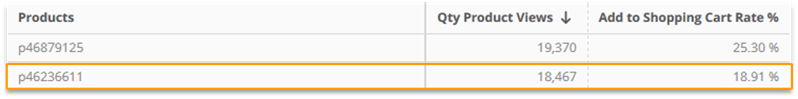
| Reading Example | |
|---|---|
| Qty Product Views | The product "p46236611" was viewed 18,467 times. |
| Add to Shopping Cart Rate % | During 18.91 % of all product views of "p46236611", the product was also added to the shopping cart. |
How does the position in a product list influence the performance of my products?
Analysis: E-Commerce > Products 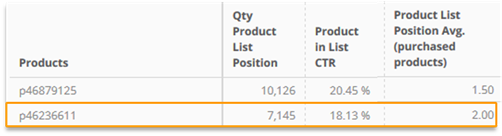
| Reading Example | |
|---|---|
| Qty Product List Position | The product "p46236611" was viewed 10,126 times in a product list. |
| Product in List CTR | During 18.13 % of all product list views of "p46236611" the product was also clicked in order to get to the product detail page. |
| Product List Position Avg. (purchased products) | When the product "p46236611" was purchased during a visit it was listed on average on position 2.00 in a product list seen during the visit. |
4.2 Products not purchased
Which products and product categories are placed into the cart frequently, but not being purchased?
Analysis: Individual Analysis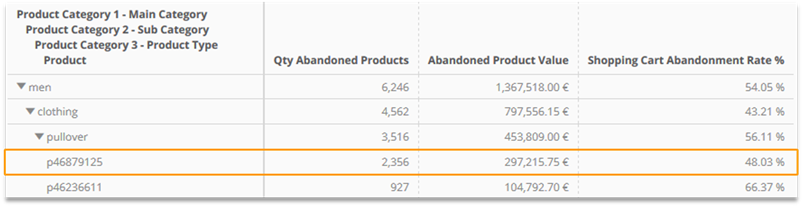
| Reading Example | |
|---|---|
| Qty Abandoned Products: | The product "p46879125" was placed 2,356 time into the shopping cart, but not purchased within the visit. |
| Value Abandoned Products | The abandoned products of "p46879125" had a total value of EUR 297,215.75. |
| Shopping Cart Abandonment Rate % | 48.03 % of all products "p46879125" that were put into the shopping cart were not purchased. |
4.3 Orders
Which orders have been tracked?
Analysis: E-Commerce > Orders separately 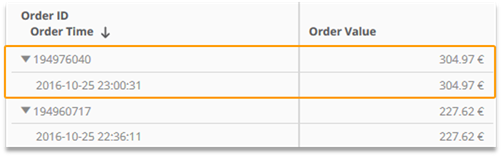
| Reading Example | |
|---|---|
| Order Value | The order number "194976040" was tracked on Oct 25 2016 at 23:00:31 and had a value of EUR 304,97. |
Download
Please note that Mapp Intelligence was named "Webtrekk Analytics" until February 2020. We work on substituting the old name with the new one. However, it may happen that descriptions still contain "Webtrekk Analytics". The content of the document is up to date.
The following exercises are designed to teach you how to work with Mapp Intelligence. You can check possible solutions in the appendix. Exercise 1 - Analyses.pdf