Distinguish good bounces from bad bounces by looking at Engagement
This article shows how to distinguish good bounces from bad bounces using engagement metrics.
General remarks
The metrics Bounces and Bounce Rate are often used for analyzing marketing campaigns. They show you in how many visits (or in which share of visits, respectively) exactly one page was viewed.
A bounce does not necessarily have to be considered as something bad. Consider the following example:
Suppose you're an online marketing manager working for a publisher. Now suppose you notice that one of your campaigns had a Bounce Rate of 80%. Your campaign linked on a single article.
Actually, the Bounce Rate does not help you here to evaluate the performance of the article. The only thing that can be derived from it is that no further page was viewed within the visit where the campaign was used (which may not be of interest for you because you probably would like to know whether the article was actually read or not).
Here, measuring Content Engagement can help you: It allows you to differ between a good bounce (one with high engagement on the landing page, e.g., more than 50% of the content was read) and a bad bounce (low engagement on the landing page, e.g., less than 50% of the content was read).
The corresponding plugin for measuring Content Engagement is available in Tag Integration. If you are not using Tag Integration, it can be integrated in the standard pixel as a separate JavaScript file.
Measuring Content Engagement does not work within Apps or for pages with subsequently loading content (Infinite Scroll).
Step 1: Creating a Parameter
First, you have to define Event Parameters in Mapp Q3. There, the information is stored.
| Parameter | Description | Type |
|---|---|---|
| Content Engagement - Name | Contains the name of the content element. | preconfigured |
| Content Engagement - Element visibility % (figure) | Shows which share of an element was shown in the browser (e.g., 25%, 50%, 75%). Allows for using content engagement as a metric. | preconfigured (ID 922) |
| Content Engagement - Element visibility % (text) | Shows which share of an element that was shown in the browser (e.g., 25%, 50%, 75%). Allows for using content engagement as a dimension. | preconfigured (ID 923) |
Example: Parameter "Content Engagement - Name"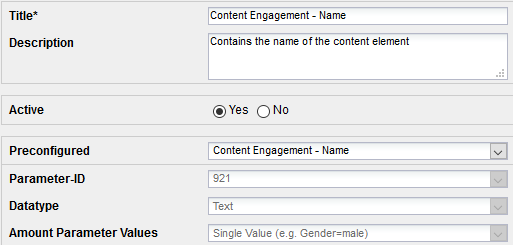
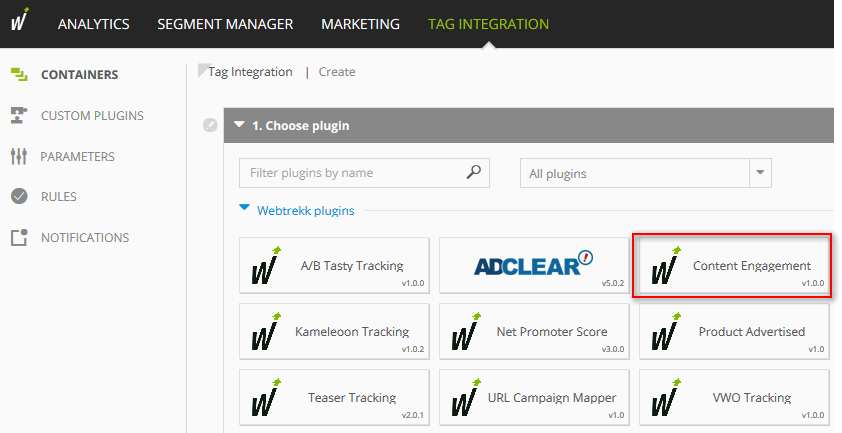
Step 2: Activation in Tag Integration
This Best Practice shows the integration of Content Engagement when using Mapp Tag Integration. In case you directly integrated the Mapp Pixel, please have a look at the technical documentation for detailed information.
Integrate the Plugin "Content Engagement" into the Container where the website that should be measured is located.
The Plugin settings can be changed in the Plugin configuration.
"Send" Configuration
A "good bounce" is quantified by the read content on the landing page. It depends on the landing page which value should be chosen here.
We recommend the following configuration: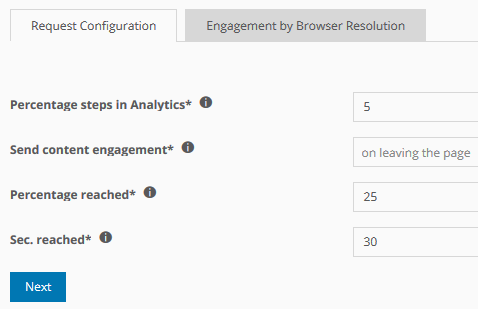
This way, you can distinguish 5 steps for each article that are sent when the corresponding step was taken. This means that if the article has been read completely, 5 different values will be passed (0%, 25%, 50%, 75% und 100%).
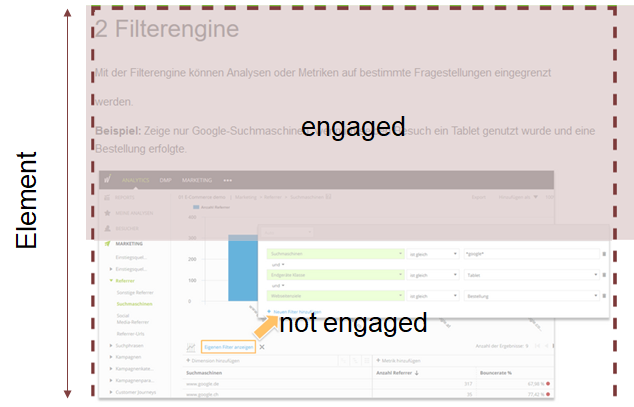
Definition of Engagement
For calculating the engagement, the content is split into equal-sized parts. Each part has to be shown for a certain amount of seconds in the browser to count as engagement.
Many websites dynamically adapt to the size of the browser window. High resolutions usually show more text than low resolutions. Consequently, the user needs more time to read the content for high resolutions. Here, the time in seconds that is necessary to count as "engagement" can be defined for three groups of browser resolution (small, medium, large).
Please note that in the debug mode (see Step 4) you can check the settings directly on your website.
At "Assign Rules" you define on which page areas the engagement should be measured.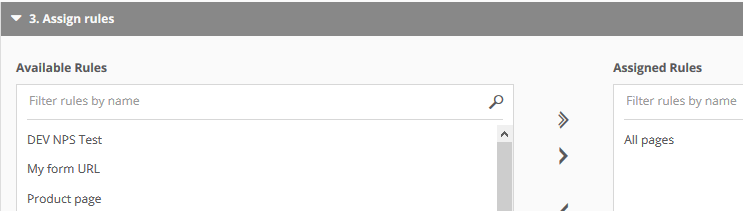
Add the plugin and publish the container.
Step 3: Integration into the Website
The elements for which engagement should be measured have to be flagged in the website code. For our purpose, it suffices to measure the complete page.
Add the following code:
window.wt_rt = window.wt_rt || [];
window.wt_rt.push(
{
selector: 'body',
}
);The page name (ContentId) will be the name of the element.
Step 4: Checking the Configuration
In the Debug mode, the configuration can be checked directly on the website.
- Is the page measured correctly as content engagement?
- Did I choose proper time intervals for counting engagement?
To this end, open the corresponding page and add the URL parameter "wt_debug=1".
Example: http://new.domain.com/start.html?wt_debug=1
Step 5: Creating a custom formula
As last step, we create a custom formula that can be used for analysis and reports in the future.
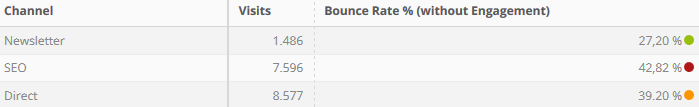
Bounce Rate % (without Engagement)
Shows for which share of entries a bounce was tracked and less than 25 percent of content engagement were measured.
Calculation:
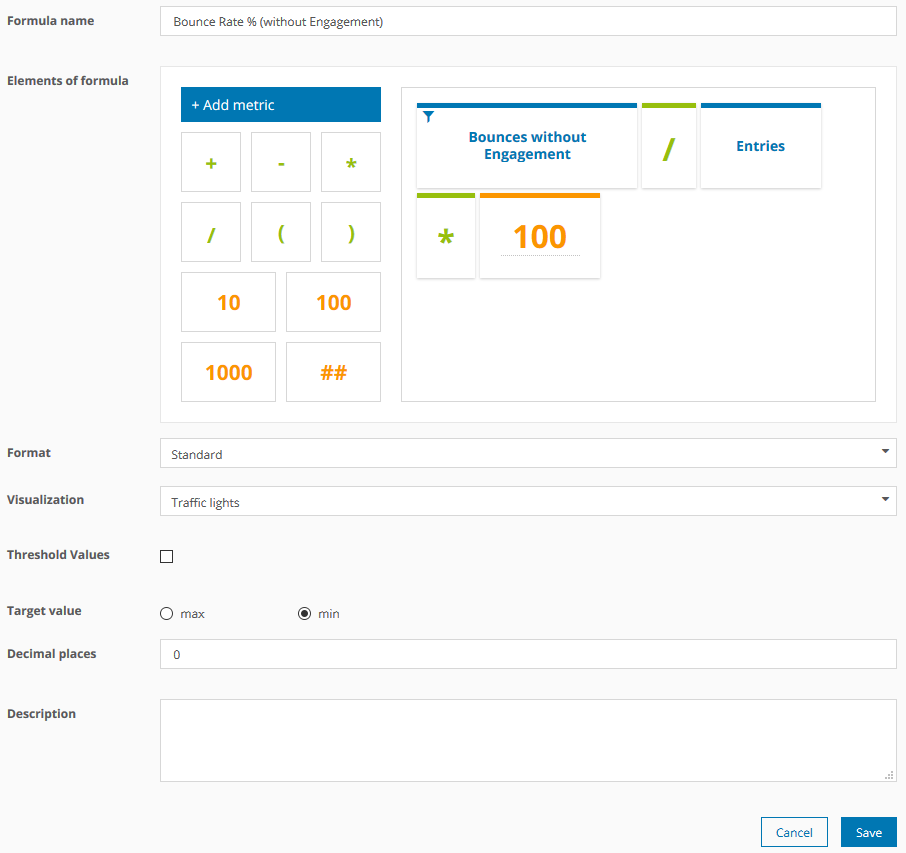
- The first element in the formula is filtered as follows:
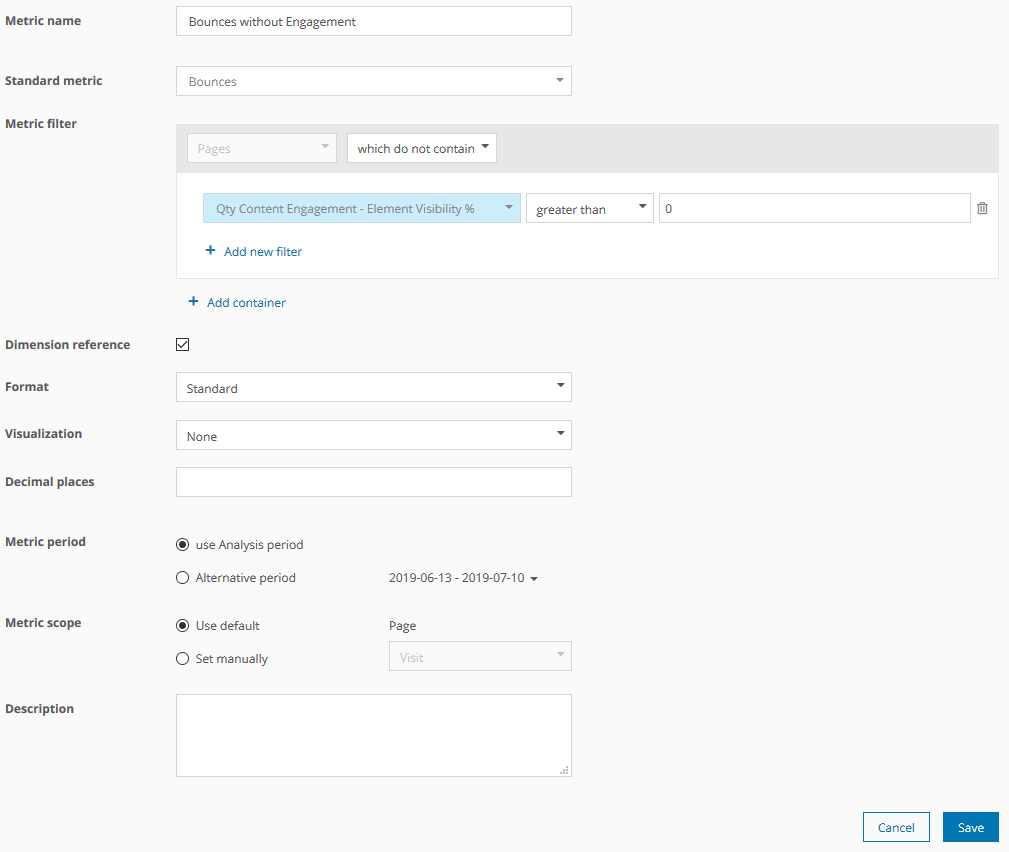
If needed, further metrics and formulas can be created, for example:
- Bounce Rate % (with Engagement)
- Bounces (without Engagement)
- Bounces (with Engagement)
- Share of Bounce Rate % (without Engagement) on Bounce Rate %