Data Streams Monitoring
This section provides you with valuable insights into overall system health and the performance of all your data streams. Here you can:
- See whether the system is running as expected
- Check the performance of your data streams and their partitions within a specific time range
- Use metrics that help you identify potential issues
General Information
All data in data streams are called “messages” and in our case, these data are whatever you track using Mapp Intelligence. Messages are sent from the Mapp servers (producers) to the so-called topics. One data stream is technically represented by one topic. Topics consist of multiple partitions so that the data can be consumed and processed faster by the consumers.
The information in the Monitoring section allows you to diagnose potential issues with the data streams and identify whether those issues are related to the Mapp system or the performance of your consumption.
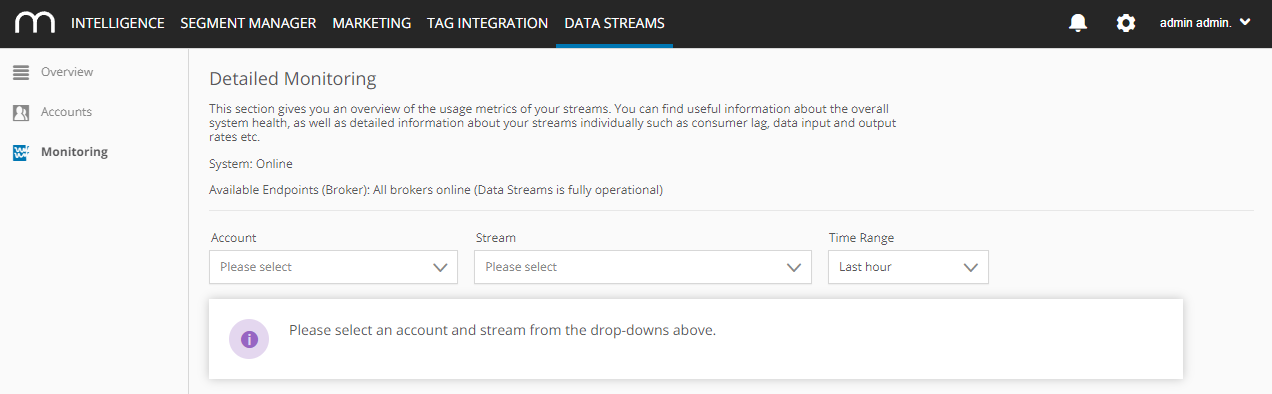
These points show the Mapp system status:
- System - informs you whether the Mapp system is working correctly
- Available Endpoints (Broker) - informs you whether the data streams servers are working correctly
System State (System) | Status Message (Available Endpoints) |
|---|---|
Online | All brokers online (Data Streams is fully operational) |
Maintenance | At least one broker is offline (Data Streams is still fully operational) |
Error | More than one broker offline (Data Streams is probably not fully operational) |
You can also view the performance of your individual data streams. When you select an account, all available streams for this account will become available in the drop-down list. The time range is by default set to the last hour, but you can filter on other time ranges, up until 31 days, the longest time the monitoring data will be stored in our system. You can look at your data streams across five different metrics.
Metrics
Metrics | Description | Interpretation |
|---|---|---|
Data input rate (messages/s) | The number of records per second currently received in a particular topic.
| These metrics help you identify if the setup (e.g., filter configuration) works as expected. It may be useful to look at both the number of messages as well as their size (bytes): Example 1 You have a custom stream that only looks at "device class = smartphone". Such a configuration affects the number of messages sent via that stream because you have excluded all other device classes. Example 2 Custom streams also allow you to decide which fields should be included or excluded from a message. You have configured your stream from Example 1 to exclude several fields. In this case, the number of messages remains the same as in Example 1, however, their size will be different because of the excluded fields. |
Data input rate (bytes/s) | The number of bytes per second currently received in a particular topic.
| |
Processing latency (milliseconds) | The processing latency of the complete processing pipeline. For custom streams it's mandatory to include the field "Ingestion Timestamp", otherwise the lag cannot be calculated. |
The latency is generally below one second, but it might be temporarily increased. See Data Fluctuations below. |
Consumer Lag (messages/partition) | The difference between written offset and committed offset of a chosen topic. The lag is calculated for each partition and depends on whether a topic is consumed at all. | This metric helps you determine if the consumers are set up and sized correctly. |
Data output rate (bytes/s) | The number of bytes per second currently read from a particular topic. | This metric helps you size the consumers according to the expected storage space.
The output rate for root streams may be higher than the input rate. This is because internally, each root stream is consumed to create a custom stream. If you have one root stream (which is consumed) and one custom stream, the data output rate will be double the size of the data input rate. |
Static Information
Under every graph, there is additional information about the monitored stream. Even though we call this "static information", it is technically not static - the information here simply changes less frequently. For example, Total Size or Individual Sizes of Partitions don't usually change that often. Also, Retention time and Number of Partitions, etc. remain the same unless your configuration is changed.
Static information | Description |
|---|---|
Retention Time | The amount of time we retain the data in the stream. |
Number of Partitions | The number of partitions of the stream. |
Total Size | The total size of the data that is in the stream. |
Size of Partition (X) | Partition size breakdown per individual partitions. |
Data Fluctuations
You might notice some fluctuations in the graphs which is expected behavior in Mapp Intelligence’s data processing. For example, during the day-end process, there will be a short drop in the incoming and outgoing data. This does not mean data loss. The data processing is deferred during the runtime of the day-end process and the data is delivered as soon as this process is finished.