Analyses 8 – Cohorts
1 Cohorts overview
A cohort in Mapp Intelligence is a group of visitors, that made their first visit in the same time period.
By using cohorts analyses the long-term development of visitors can be analyzed.
In this context often the sustainability of different marketing measures is compared, e.g. the question "What revenue was generated by visitors in the first 6 months after their first visit, whose access was made via a display campaign?".
2 different point of views can be analyzed via cohorts analyses:
- Date of the first visit
- Time since the first visit
2 Date of the first visit
The date of the first visit can be depicted as day, week, or month.
Dimensions | Description |
|---|---|
Cohorts (Monthly) | Shows the date of the first visit of new visitors in the format YYYY-MM. |
Cohorts (Weekly) | Shows the date of the first visit of new visitors in the format YYYY-WW. |
Cohorts (Daily) | Shows the date of the first visit of new visitors in the format YYYY-MM-DD. |
- The complete time interval of the cohort (full month, full week, full day) has to be selected as analysis time period.
- Cohorts are only calculated for concluded time periods (until last month, until last week, until yesterday).
- In most cases specifically defined key figures are used for the analysis, that shows information about the user activity in the subsequent time frames.
2.1 Predefined analyses
A selection of predefined analyses is available in the report Reports > Overview > Cohorts Performance.
Loyality
The loyality shows, what percentage of new visitors of a specific month visited the website in the following time periods again.
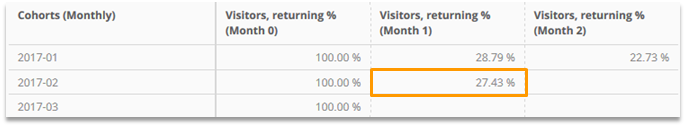
| Reading Example | |
|---|---|
| Visitors, returning % (Month 1) | 27.43 % of all new visitors in February were active one month later, too. |
For analyzing the cohorts interval shown in the example, the analysis time period has to be set to 01.01. – 31.03.2017.
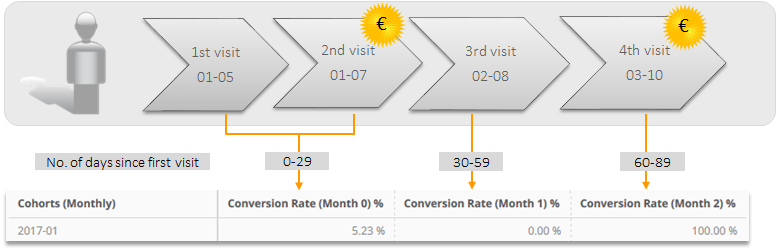
The "month" depicted in the metric includes a time span of 30 days each.
Example: 1 user
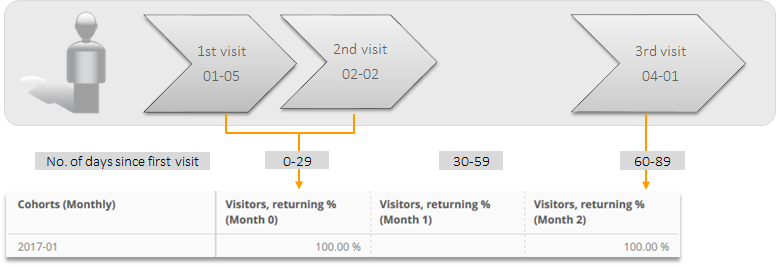
| Reading Example | |
|---|---|
| Cohorts (Monthly) | We look at all users, whose first visit was made in January 2017. |
| Visitors, returning % (Month 0) | Both visits were made within 30 days after the first visit and therefore are assigned here. |
| Visitors, returning % (Month 1) | 30-59 days after the first visit no access was made. |
| Visitors, returning % (Month 2) | 60-89 days after the first visit another visit was made. |
Example: 2 users
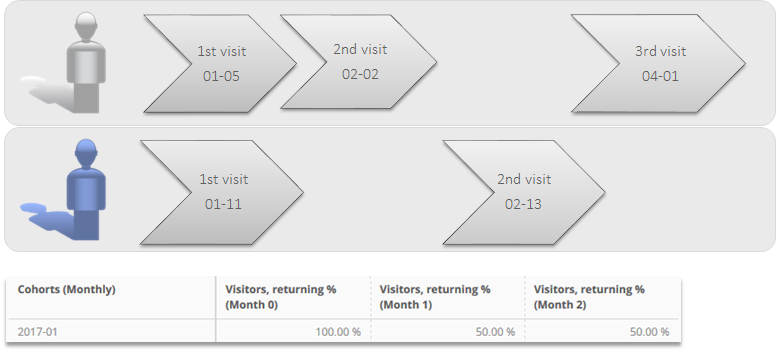
| Reading Example | |
|---|---|
| Visitors, returning % (Month 1) | For 50 % of all users, another access was made 30-59 days after the first visit. |
| Visitors, returning % (Month 2) | For 50 % of all users, another access was made 60-89 days after the first visit. |
Conversion Rate
The analysis shows the development of the conversion rate since the first visit.
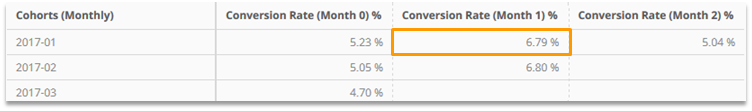
| Reading Example | |
|---|---|
| Conversion Rate (Month 1) % | 6.79 % of all new visitors made an order in month 1 (30th-59th day) after their first visit. |
Calculation of Conversion Rate (Month): Qty Order / Visitors (per month) * 100
| Reading Example | |
|---|---|
| Cohorts (Monthly) | We look at all users, whose first visit was made in January 2017. |
| Conversion Rate (Month 0) % | All visitors made an order within the first 29 days after their first visit. |
| Conversion Rate (Month 1) % | No visitor made an order within 30-59 days after the first visit. |
| Conversion Rate (Month 2) % | All visitors made an order within 60-89 days after their first visit. |
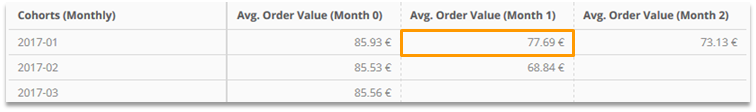
Avg Basket Value
The analysis shows the development of the average order value per month.
| Reading Example | |
|---|---|
| Avg. Order Value (Month 1) | New visitors of January generated orders with an average order value of 77.69 € within month 1 (30-59 days) after their first visit. |
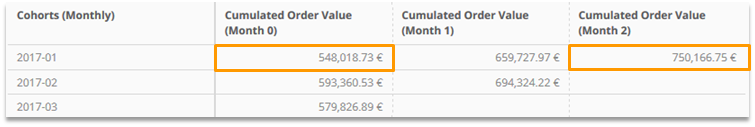
Customer Lifetime Value
The analysis shows the development of the accumulated order value per month.
| Reading Example | |
|---|---|
| Cumulated Order Value (Month 0) | New visitors from January generated a total order value of 548,018.73 € within the first 29 days after their first visit. |
| Cumulated Order Value (Month 2) | For new visitors from January, 60-89 days after their first visit the total order value increased to 750,166.75 €. |
2.2 Daily and weekly cohorts
If you want to analyze daily or weekly cohorts, you have to set up custom key figures.
- For a permanent availability, these metrics have to be defined at "Custom Figures".
- Filter the desired metric via "Cohorts (Lifespan) [...]" on the corresponding week/day.
Example:
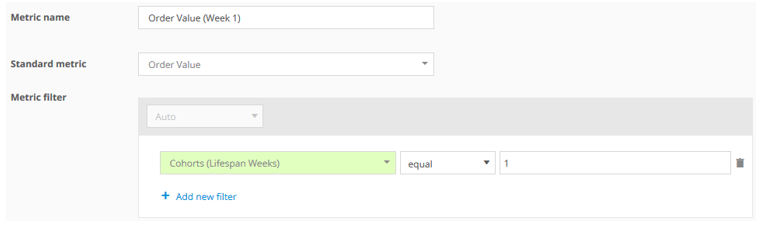
Use the following calculation when setting up the formulas for a weekly analysis:
- Loyality
Visitors, returning % (Week N) = Visitors (Lifespan Week N) / Visitors (Lifespan Week 0) * 100 - Conversion Rate
Conversion Rate (Week N) % = Qty Orders (Lifespan Week N) / Visitors (Lifespan Week 0) * 100 - Avg Basket Value
Avg. Order Value (Week N) = Order Value (Lifespan Week N) / Qty Orders (Lifespan Week N) - Customer Lifetime Value
Cumulated Order Value (Week N) = Order Value (Lifespan Week 0) + […] + Order Value (Lifespan Week N)
2.3 Filtering cohorts
Cohorts can be limited to specific questions by using the filter engine. While doing so, the scope has to be considered.
Possible scopes are explained by using the example of filtering on a campaign channel.
Limiting on the user
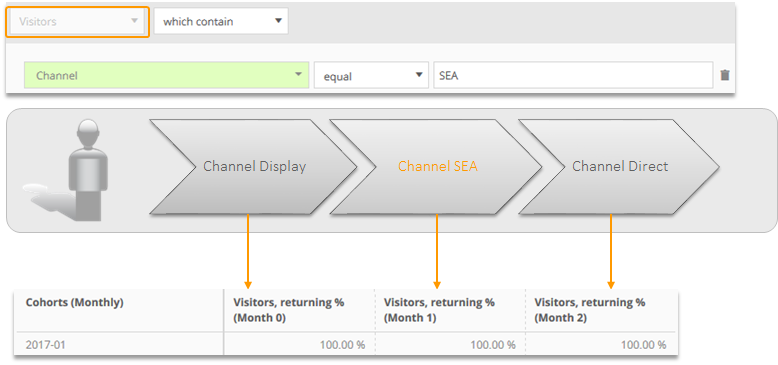
All visits by users are depicted, that used the channel "SEA" at some time within the analysis time period.
Limiting on specific visits of a user
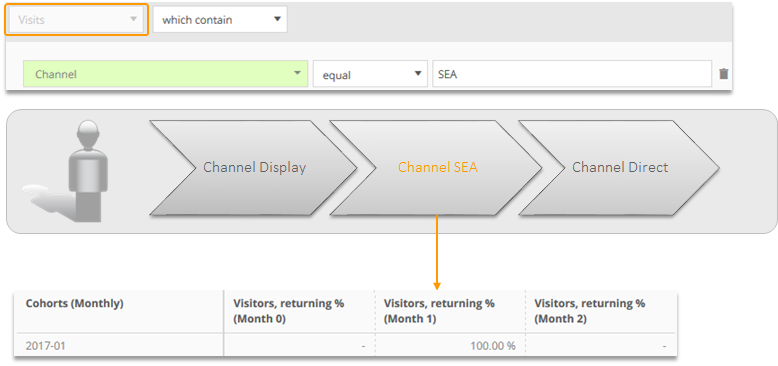
Only visits via the channel "SEA" are depicted.
Limiting on the first visit
By using the filter "New vs. Returning" it is ensured, that the channel was tracked in the first visit.
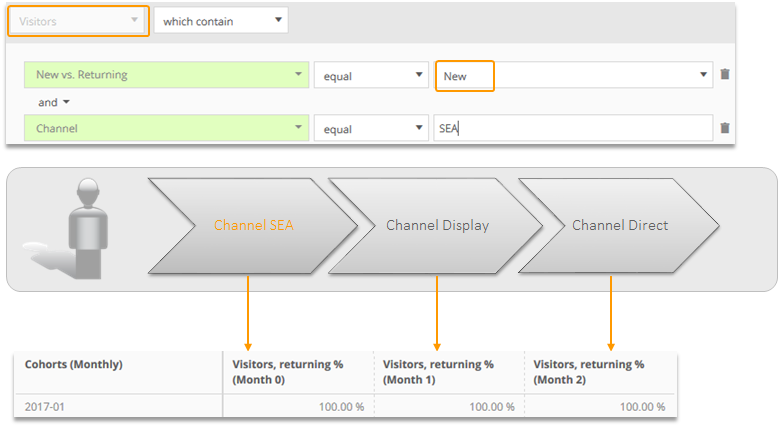
All visits are depicted if the first visit was made via the channel "SEA".
2.4 Use Cases
In the long run, how sustainably returned new visitors via the campaign channel "SEO" to the website per month?
Analysis: Individual Analysis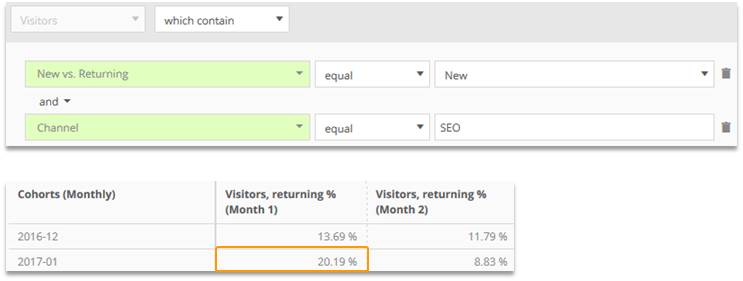
| Reading Example | |
|---|---|
| Visitors, returning % (Month 1) | 20.19 % of all new visitors via the channel "SEO" accessed the website again within 30-59 days after their first visit. |
How did the order value develop, that was calculatively generated by each user?
Analysis: Individual Analysis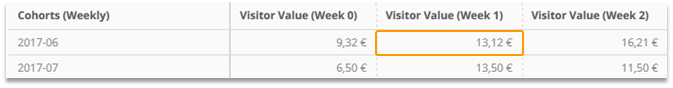
| Reading Example | |
|---|---|
| Visitor Value (Week 1)* | Calculatively, each returning visitor generated 13,12 € in week 1. |
*This is a custom formula.
These figures have to be set up as custom formulas.
Example of calculation "Visitor Value (Week 1)": Order Value (Filter: Cohorts (Lifespan Week N)) / Visitors (Filter: Cohorts (Lifespan Week N))
Within which individual time clusters did users return?
Analysis: Individual Analysis
| Reading Example | |
|---|---|
| Returning Visitors % (Days 3-6)* | 8.06 % of all new visitors from February 1 visited the website again between 3 and 6 days later. |
*This is a custom formula.
These figures have to be set up as custom formulas.
Example of calculation "Returning Visitors % (Days 3-6)": Visitors (Lifespan Days between 3 and 6) / Visitors (Lifespan days 0) * 100
3 Time since the first visit
The time since the first visit can be depicted as day, week, or month.
Dimensions | Description |
|---|---|
Cohorts (Lifespan Months) | The time span in months, that passed between the first and a subsequent visit. |
Cohorts (Lifespan Weeks) | The time span in weeks, that passed between the first and a subsequent visit. |
Cohorts (Lifespan Days) | The time span in days, that passed between the first and a subsequent visit. |
For each visit, the time span is calculated.

3.1 Filtering
Cohorts can be limited to certain events by using the filter engine.
The following example shows frequently used filters and the analysis results.

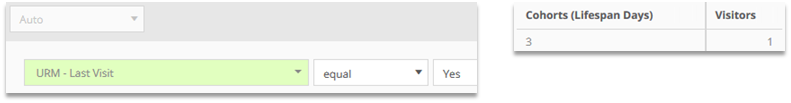
How many days passed between the first visit and the last visit?
How many days passed between the first visit and the first purchase?

3.2 Use Cases
How many weeks passed between the first visit and the registration?
Analysis: Individual Analysis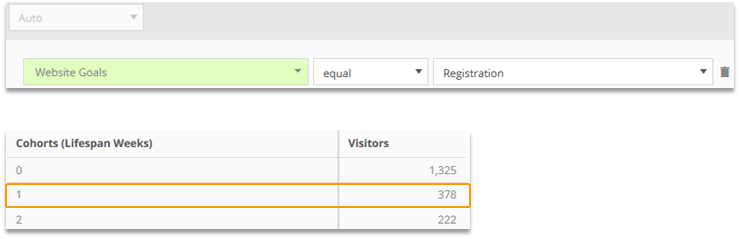
| Reading Example | |
|---|---|
| Visitors | 378 users registered 1 week (= 7-15 days) after their first visit. |
How many weeks passed until users made a certain amount of visits?
Analysis: Individual Analysis
| Reading Example | |
|---|---|
| Visitors | For 1,069 users the third visit was made within the first week (= 0-6 days). |
Which different lifespans exist per campaign channel?
Analysis: Individual Analysis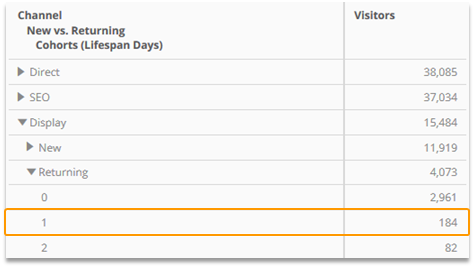
| Reading Example | |
|---|---|
| Visitors | 184 users visited via the channel "Display", were returning visitors and the access happened one week after their first visit. |
How is the lifespan spread in weeks per campaign channel?
Analysis: Individual Analysis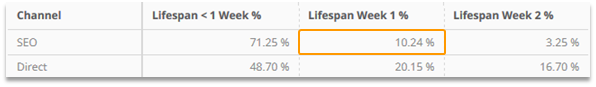
| Reading Example | |
|---|---|
| Lifespan Week 1 %* | 10.24 % of the accesses via the channel "SEO" was made by users, whose first visit was made between 7 and 15 days before. |
*This is a custom formula.
These figures have to be set up as custom formulas.
Example of calculation "Lifespan Week 1 %": Visitors (Lifespan Week 1) / Visitors * 100